Dutch vs Immigrants from Austria Hearing Disability
COMPARE
Dutch
Immigrants from Austria
Hearing Disability
Hearing Disability Comparison
Dutch
Immigrants from Austria
3.7%
HEARING DISABILITY
0.0/ 100
METRIC RATING
302nd/ 347
METRIC RANK
3.3%
HEARING DISABILITY
1.8/ 100
METRIC RATING
237th/ 347
METRIC RANK
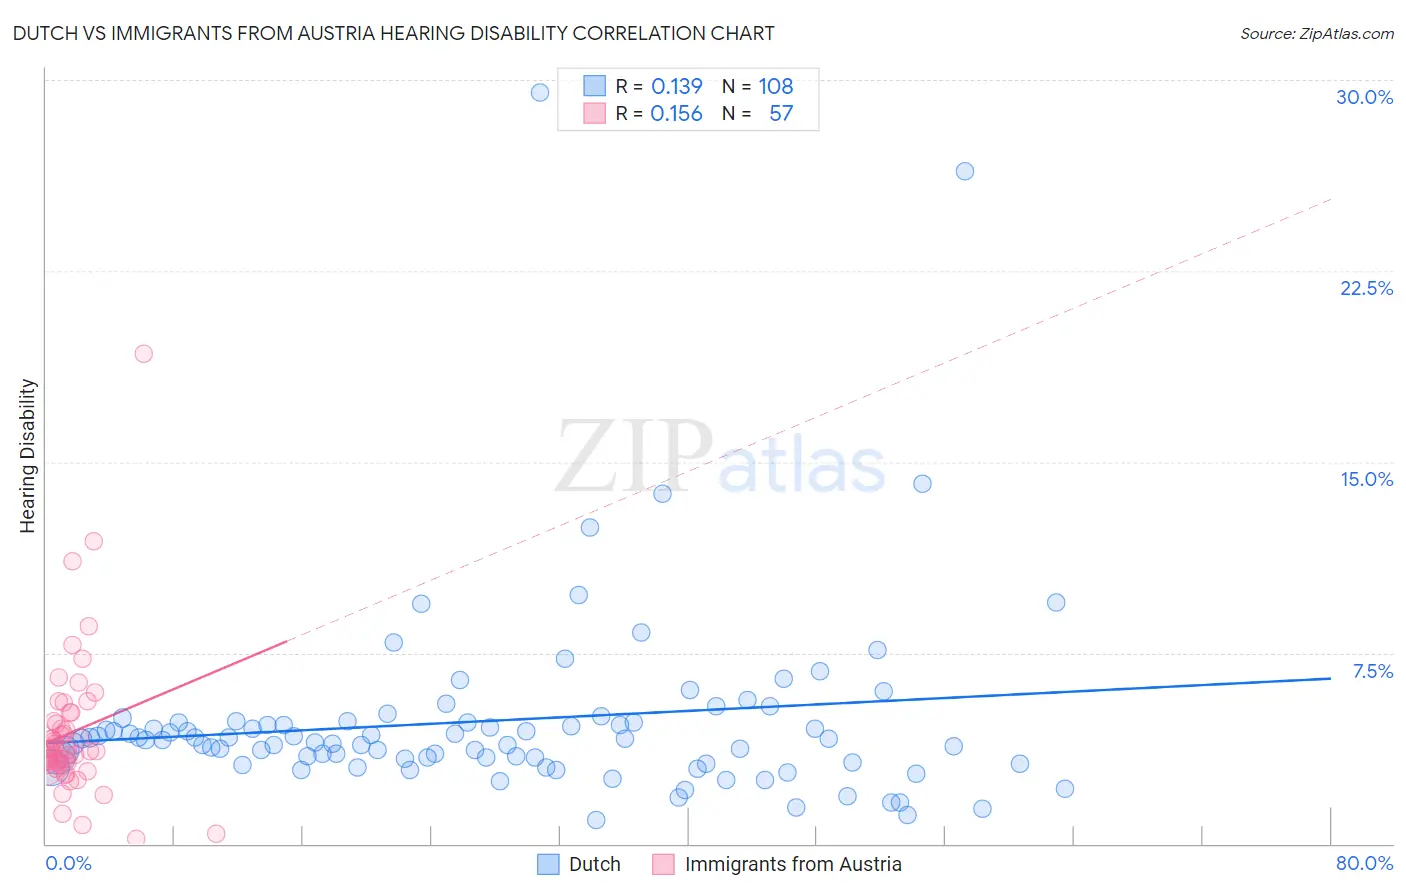
Dutch vs Immigrants from Austria Hearing Disability Correlation Chart
The statistical analysis conducted on geographies consisting of 553,868,421 people shows a poor positive correlation between the proportion of Dutch and percentage of population with hearing disability in the United States with a correlation coefficient (R) of 0.139 and weighted average of 3.7%. Similarly, the statistical analysis conducted on geographies consisting of 167,968,666 people shows a poor positive correlation between the proportion of Immigrants from Austria and percentage of population with hearing disability in the United States with a correlation coefficient (R) of 0.156 and weighted average of 3.3%, a difference of 14.2%.
Hearing Disability Correlation Summary
| Measurement | Dutch | Immigrants from Austria |
| Minimum | 0.93% | 0.21% |
| Maximum | 29.5% | 19.2% |
| Range | 28.6% | 19.0% |
| Mean | 4.8% | 4.4% |
| Median | 4.1% | 3.7% |
| Interquartile 25% (IQ1) | 3.3% | 3.1% |
| Interquartile 75% (IQ3) | 4.8% | 5.0% |
| Interquartile Range (IQR) | 1.5% | 1.9% |
| Standard Deviation (Sample) | 3.9% | 2.9% |
| Standard Deviation (Population) | 3.9% | 2.9% |
Similar Demographics by Hearing Disability
Demographics Similar to Dutch by Hearing Disability
In terms of hearing disability, the demographic groups most similar to Dutch are Menominee (3.7%, a difference of 0.060%), Pennsylvania German (3.7%, a difference of 0.11%), Scottish (3.7%, a difference of 0.13%), German (3.7%, a difference of 0.20%), and French (3.8%, a difference of 0.36%).
| Demographics | Rating | Rank | Hearing Disability |
| Welsh | 0.0 /100 | #295 | Tragic 3.7% |
| Pima | 0.0 /100 | #296 | Tragic 3.7% |
| Immigrants | Azores | 0.0 /100 | #297 | Tragic 3.7% |
| Celtics | 0.0 /100 | #298 | Tragic 3.7% |
| Germans | 0.0 /100 | #299 | Tragic 3.7% |
| Scottish | 0.0 /100 | #300 | Tragic 3.7% |
| Pennsylvania Germans | 0.0 /100 | #301 | Tragic 3.7% |
| Dutch | 0.0 /100 | #302 | Tragic 3.7% |
| Menominee | 0.0 /100 | #303 | Tragic 3.7% |
| French | 0.0 /100 | #304 | Tragic 3.8% |
| English | 0.0 /100 | #305 | Tragic 3.8% |
| Marshallese | 0.0 /100 | #306 | Tragic 3.8% |
| French Canadians | 0.0 /100 | #307 | Tragic 3.8% |
| Ottawa | 0.0 /100 | #308 | Tragic 3.8% |
| Scotch-Irish | 0.0 /100 | #309 | Tragic 3.8% |
Demographics Similar to Immigrants from Austria by Hearing Disability
In terms of hearing disability, the demographic groups most similar to Immigrants from Austria are German Russian (3.3%, a difference of 0.0%), Serbian (3.3%, a difference of 0.39%), Guamanian/Chamorro (3.3%, a difference of 0.46%), Central American Indian (3.3%, a difference of 0.56%), and Estonian (3.3%, a difference of 0.63%).
| Demographics | Rating | Rank | Hearing Disability |
| Greeks | 3.2 /100 | #230 | Tragic 3.2% |
| Luxembourgers | 2.9 /100 | #231 | Tragic 3.2% |
| Ukrainians | 2.9 /100 | #232 | Tragic 3.2% |
| Estonians | 2.4 /100 | #233 | Tragic 3.3% |
| Central American Indians | 2.3 /100 | #234 | Tragic 3.3% |
| Guamanians/Chamorros | 2.2 /100 | #235 | Tragic 3.3% |
| Serbians | 2.2 /100 | #236 | Tragic 3.3% |
| Immigrants | Austria | 1.8 /100 | #237 | Tragic 3.3% |
| German Russians | 1.8 /100 | #238 | Tragic 3.3% |
| Nepalese | 1.2 /100 | #239 | Tragic 3.3% |
| Immigrants | Netherlands | 1.1 /100 | #240 | Tragic 3.3% |
| Samoans | 1.1 /100 | #241 | Tragic 3.3% |
| Yugoslavians | 1.0 /100 | #242 | Tragic 3.3% |
| Immigrants | Western Europe | 1.0 /100 | #243 | Tragic 3.3% |
| Assyrians/Chaldeans/Syriacs | 0.9 /100 | #244 | Tragic 3.3% |