Czech vs German Hearing Disability
COMPARE
Czech
German
Hearing Disability
Hearing Disability Comparison
Czechs
Germans
3.5%
HEARING DISABILITY
0.1/ 100
METRIC RATING
271st/ 347
METRIC RANK
3.7%
HEARING DISABILITY
0.0/ 100
METRIC RATING
299th/ 347
METRIC RANK
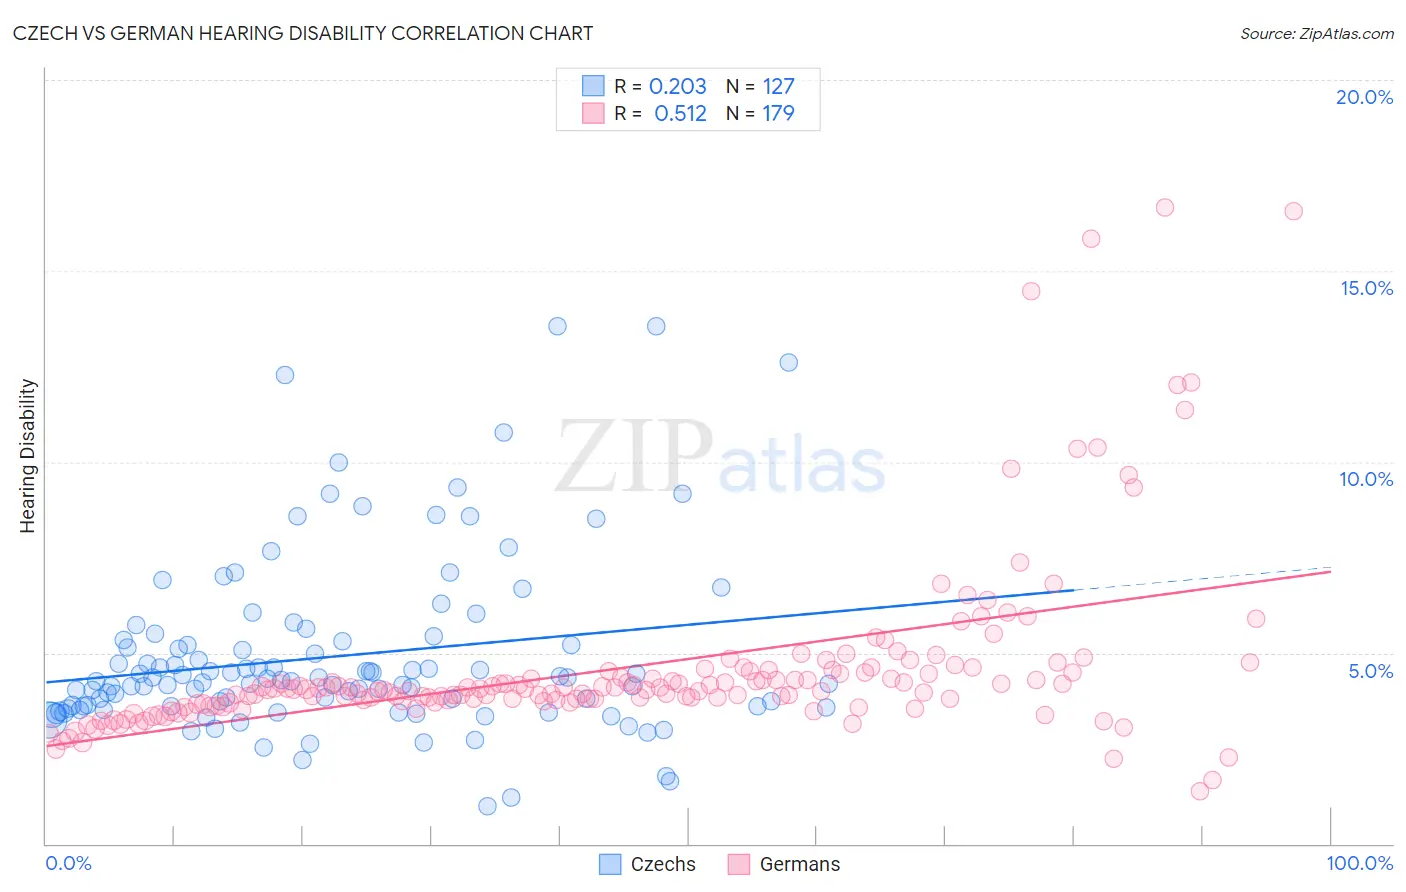
Czech vs German Hearing Disability Correlation Chart
The statistical analysis conducted on geographies consisting of 484,559,350 people shows a weak positive correlation between the proportion of Czechs and percentage of population with hearing disability in the United States with a correlation coefficient (R) of 0.203 and weighted average of 3.5%. Similarly, the statistical analysis conducted on geographies consisting of 580,131,605 people shows a substantial positive correlation between the proportion of Germans and percentage of population with hearing disability in the United States with a correlation coefficient (R) of 0.512 and weighted average of 3.7%, a difference of 6.0%.
Hearing Disability Correlation Summary
| Measurement | Czech | German |
| Minimum | 0.98% | 1.4% |
| Maximum | 13.6% | 16.7% |
| Range | 12.6% | 15.3% |
| Mean | 4.9% | 4.6% |
| Median | 4.3% | 4.1% |
| Interquartile 25% (IQ1) | 3.6% | 3.7% |
| Interquartile 75% (IQ3) | 5.3% | 4.5% |
| Interquartile Range (IQR) | 1.7% | 0.75% |
| Standard Deviation (Sample) | 2.3% | 2.3% |
| Standard Deviation (Population) | 2.3% | 2.3% |
Similar Demographics by Hearing Disability
Demographics Similar to Czechs by Hearing Disability
In terms of hearing disability, the demographic groups most similar to Czechs are European (3.5%, a difference of 0.26%), Fijian (3.5%, a difference of 0.26%), Puerto Rican (3.5%, a difference of 0.33%), Ute (3.5%, a difference of 0.61%), and Swiss (3.5%, a difference of 0.66%).
| Demographics | Rating | Rank | Hearing Disability |
| Immigrants | Germany | 0.1 /100 | #264 | Tragic 3.5% |
| British | 0.1 /100 | #265 | Tragic 3.5% |
| Belgians | 0.1 /100 | #266 | Tragic 3.5% |
| Canadians | 0.1 /100 | #267 | Tragic 3.5% |
| Spaniards | 0.1 /100 | #268 | Tragic 3.5% |
| Ute | 0.1 /100 | #269 | Tragic 3.5% |
| Europeans | 0.1 /100 | #270 | Tragic 3.5% |
| Czechs | 0.1 /100 | #271 | Tragic 3.5% |
| Fijians | 0.0 /100 | #272 | Tragic 3.5% |
| Puerto Ricans | 0.0 /100 | #273 | Tragic 3.5% |
| Swiss | 0.0 /100 | #274 | Tragic 3.5% |
| Czechoslovakians | 0.0 /100 | #275 | Tragic 3.6% |
| Danes | 0.0 /100 | #276 | Tragic 3.6% |
| Immigrants | Nonimmigrants | 0.0 /100 | #277 | Tragic 3.6% |
| Basques | 0.0 /100 | #278 | Tragic 3.6% |
Demographics Similar to Germans by Hearing Disability
In terms of hearing disability, the demographic groups most similar to Germans are Scottish (3.7%, a difference of 0.060%), Pennsylvania German (3.7%, a difference of 0.090%), Dutch (3.7%, a difference of 0.20%), Menominee (3.7%, a difference of 0.25%), and Celtic (3.7%, a difference of 0.28%).
| Demographics | Rating | Rank | Hearing Disability |
| Native Hawaiians | 0.0 /100 | #292 | Tragic 3.7% |
| Norwegians | 0.0 /100 | #293 | Tragic 3.7% |
| Iroquois | 0.0 /100 | #294 | Tragic 3.7% |
| Welsh | 0.0 /100 | #295 | Tragic 3.7% |
| Pima | 0.0 /100 | #296 | Tragic 3.7% |
| Immigrants | Azores | 0.0 /100 | #297 | Tragic 3.7% |
| Celtics | 0.0 /100 | #298 | Tragic 3.7% |
| Germans | 0.0 /100 | #299 | Tragic 3.7% |
| Scottish | 0.0 /100 | #300 | Tragic 3.7% |
| Pennsylvania Germans | 0.0 /100 | #301 | Tragic 3.7% |
| Dutch | 0.0 /100 | #302 | Tragic 3.7% |
| Menominee | 0.0 /100 | #303 | Tragic 3.7% |
| French | 0.0 /100 | #304 | Tragic 3.8% |
| English | 0.0 /100 | #305 | Tragic 3.8% |
| Marshallese | 0.0 /100 | #306 | Tragic 3.8% |