Uruguayan vs Immigrants from Austria Hearing Disability
COMPARE
Uruguayan
Immigrants from Austria
Hearing Disability
Hearing Disability Comparison
Uruguayans
Immigrants from Austria
2.8%
HEARING DISABILITY
95.9/ 100
METRIC RATING
94th/ 347
METRIC RANK
3.3%
HEARING DISABILITY
1.8/ 100
METRIC RATING
237th/ 347
METRIC RANK
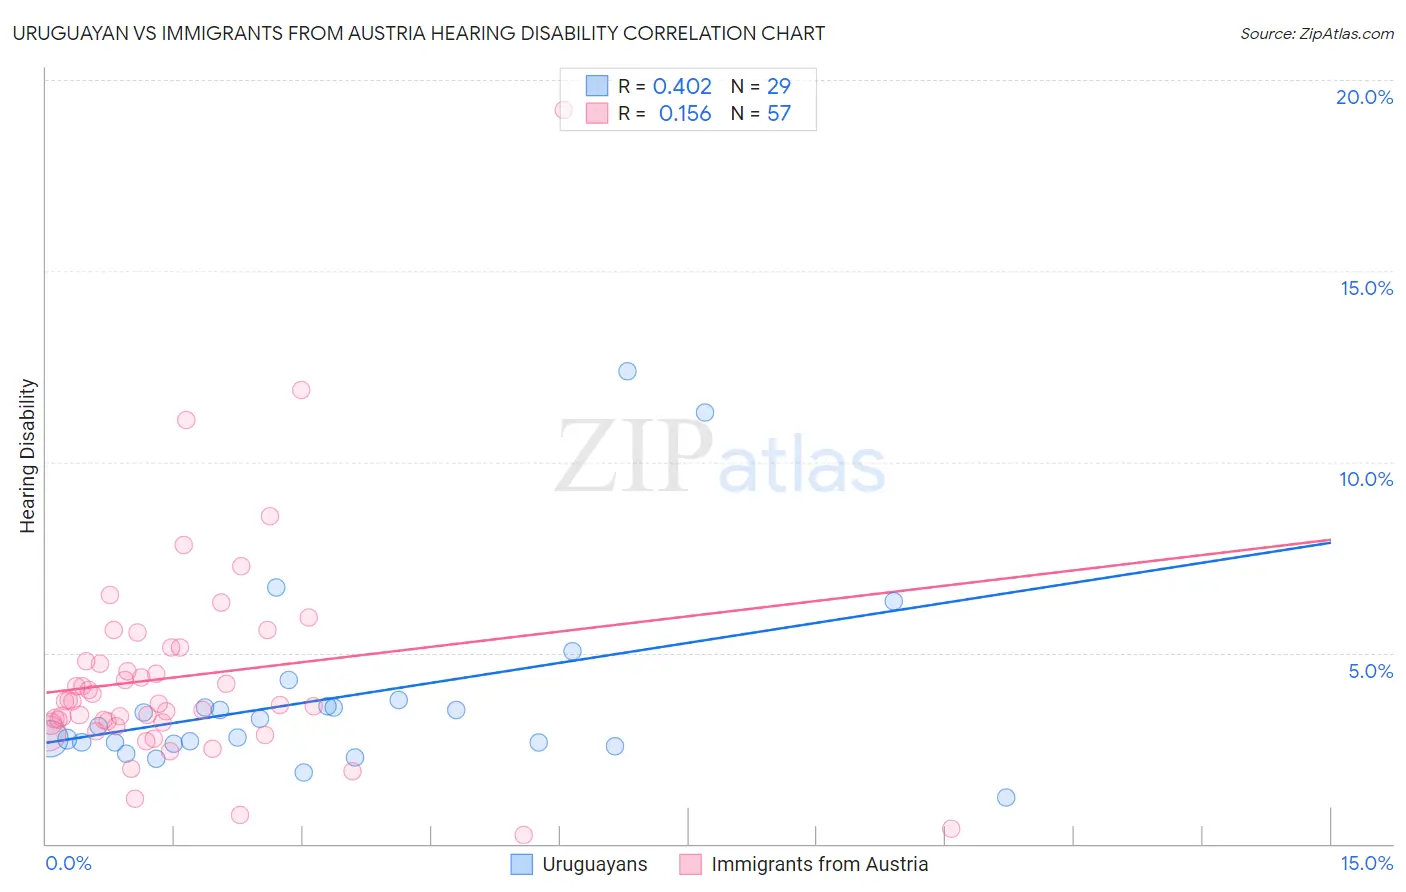
Uruguayan vs Immigrants from Austria Hearing Disability Correlation Chart
The statistical analysis conducted on geographies consisting of 144,775,965 people shows a moderate positive correlation between the proportion of Uruguayans and percentage of population with hearing disability in the United States with a correlation coefficient (R) of 0.402 and weighted average of 2.8%. Similarly, the statistical analysis conducted on geographies consisting of 167,968,666 people shows a poor positive correlation between the proportion of Immigrants from Austria and percentage of population with hearing disability in the United States with a correlation coefficient (R) of 0.156 and weighted average of 3.3%, a difference of 18.1%.
Hearing Disability Correlation Summary
| Measurement | Uruguayan | Immigrants from Austria |
| Minimum | 1.2% | 0.21% |
| Maximum | 12.4% | 19.2% |
| Range | 11.2% | 19.0% |
| Mean | 3.8% | 4.4% |
| Median | 3.1% | 3.7% |
| Interquartile 25% (IQ1) | 2.6% | 3.1% |
| Interquartile 75% (IQ3) | 3.7% | 5.0% |
| Interquartile Range (IQR) | 1.0% | 1.9% |
| Standard Deviation (Sample) | 2.5% | 2.9% |
| Standard Deviation (Population) | 2.5% | 2.9% |
Similar Demographics by Hearing Disability
Demographics Similar to Uruguayans by Hearing Disability
In terms of hearing disability, the demographic groups most similar to Uruguayans are Israeli (2.8%, a difference of 0.020%), Immigrants from Somalia (2.8%, a difference of 0.21%), Immigrants from Kuwait (2.8%, a difference of 0.27%), Immigrants from Afghanistan (2.8%, a difference of 0.38%), and Iranian (2.8%, a difference of 0.39%).
| Demographics | Rating | Rank | Hearing Disability |
| Somalis | 96.7 /100 | #87 | Exceptional 2.8% |
| Immigrants | Turkey | 96.7 /100 | #88 | Exceptional 2.8% |
| Belizeans | 96.6 /100 | #89 | Exceptional 2.8% |
| Immigrants | Morocco | 96.6 /100 | #90 | Exceptional 2.8% |
| Immigrants | Middle Africa | 96.5 /100 | #91 | Exceptional 2.8% |
| Iranians | 96.4 /100 | #92 | Exceptional 2.8% |
| Immigrants | Kuwait | 96.3 /100 | #93 | Exceptional 2.8% |
| Uruguayans | 95.9 /100 | #94 | Exceptional 2.8% |
| Israelis | 95.9 /100 | #95 | Exceptional 2.8% |
| Immigrants | Somalia | 95.5 /100 | #96 | Exceptional 2.8% |
| Immigrants | Afghanistan | 95.3 /100 | #97 | Exceptional 2.8% |
| Immigrants | Honduras | 95.1 /100 | #98 | Exceptional 2.8% |
| Immigrants | Guatemala | 95.1 /100 | #99 | Exceptional 2.8% |
| Immigrants | Eastern Africa | 95.0 /100 | #100 | Exceptional 2.8% |
| Immigrants | Spain | 94.9 /100 | #101 | Exceptional 2.8% |
Demographics Similar to Immigrants from Austria by Hearing Disability
In terms of hearing disability, the demographic groups most similar to Immigrants from Austria are German Russian (3.3%, a difference of 0.0%), Serbian (3.3%, a difference of 0.39%), Guamanian/Chamorro (3.3%, a difference of 0.46%), Central American Indian (3.3%, a difference of 0.56%), and Estonian (3.3%, a difference of 0.63%).
| Demographics | Rating | Rank | Hearing Disability |
| Greeks | 3.2 /100 | #230 | Tragic 3.2% |
| Luxembourgers | 2.9 /100 | #231 | Tragic 3.2% |
| Ukrainians | 2.9 /100 | #232 | Tragic 3.2% |
| Estonians | 2.4 /100 | #233 | Tragic 3.3% |
| Central American Indians | 2.3 /100 | #234 | Tragic 3.3% |
| Guamanians/Chamorros | 2.2 /100 | #235 | Tragic 3.3% |
| Serbians | 2.2 /100 | #236 | Tragic 3.3% |
| Immigrants | Austria | 1.8 /100 | #237 | Tragic 3.3% |
| German Russians | 1.8 /100 | #238 | Tragic 3.3% |
| Nepalese | 1.2 /100 | #239 | Tragic 3.3% |
| Immigrants | Netherlands | 1.1 /100 | #240 | Tragic 3.3% |
| Samoans | 1.1 /100 | #241 | Tragic 3.3% |
| Yugoslavians | 1.0 /100 | #242 | Tragic 3.3% |
| Immigrants | Western Europe | 1.0 /100 | #243 | Tragic 3.3% |
| Assyrians/Chaldeans/Syriacs | 0.9 /100 | #244 | Tragic 3.3% |