Cypriot vs Nonimmigrants In Labor Force | Age 25-29
COMPARE
Cypriot
Nonimmigrants
In Labor Force | Age 25-29
In Labor Force | Age 25-29 Comparison
Cypriots
Nonimmigrants
85.8%
IN LABOR FORCE | AGE 25-29
99.9/ 100
METRIC RATING
35th/ 347
METRIC RANK
83.7%
IN LABOR FORCE | AGE 25-29
0.3/ 100
METRIC RATING
248th/ 347
METRIC RANK
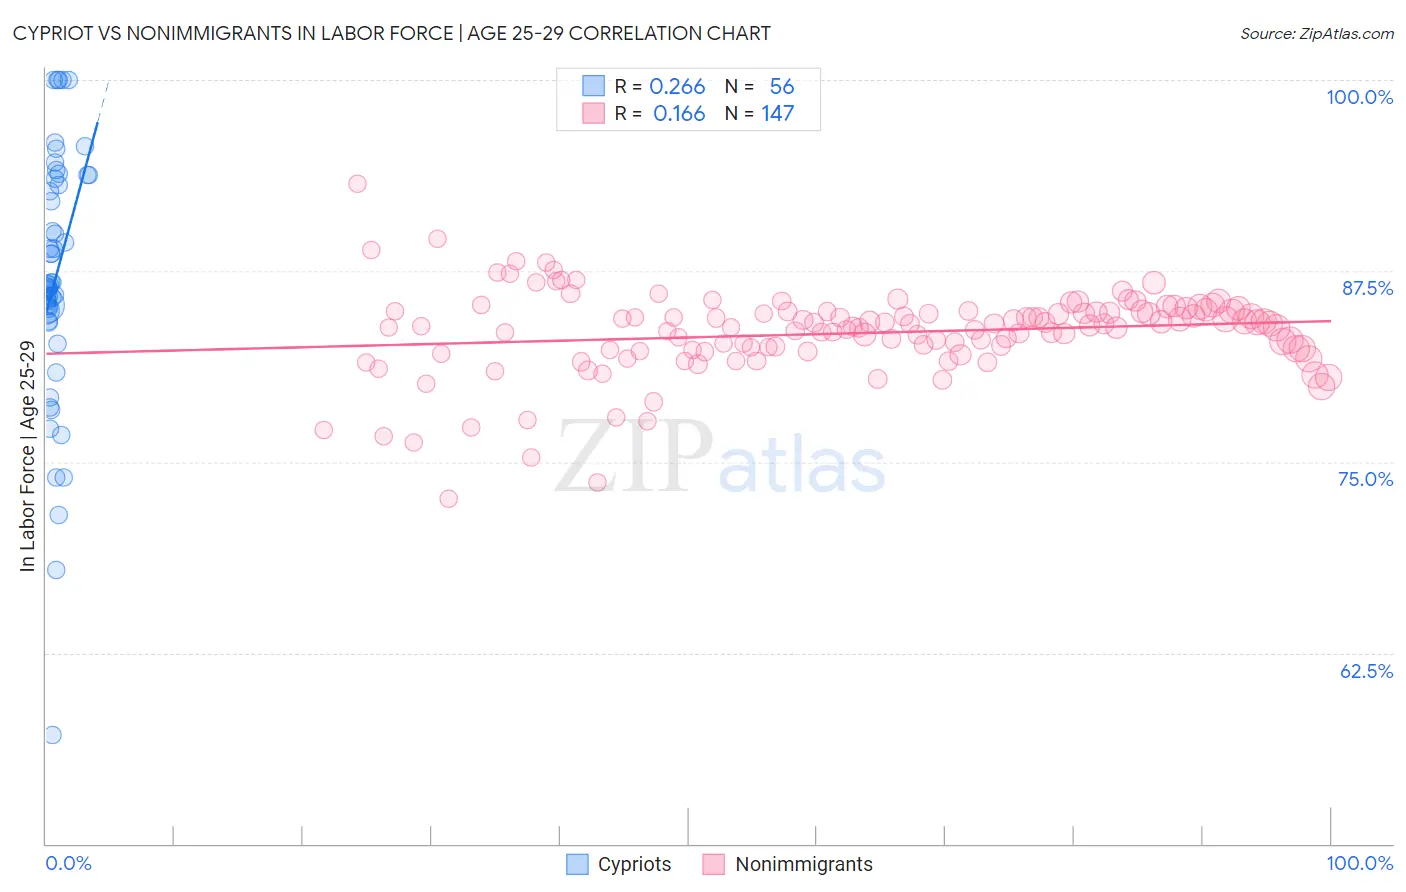
Cypriot vs Nonimmigrants In Labor Force | Age 25-29 Correlation Chart
The statistical analysis conducted on geographies consisting of 61,853,224 people shows a weak positive correlation between the proportion of Cypriots and labor force participation rate among population between the ages 25 and 29 in the United States with a correlation coefficient (R) of 0.266 and weighted average of 85.8%. Similarly, the statistical analysis conducted on geographies consisting of 582,659,660 people shows a poor positive correlation between the proportion of Nonimmigrants and labor force participation rate among population between the ages 25 and 29 in the United States with a correlation coefficient (R) of 0.166 and weighted average of 83.7%, a difference of 2.5%.
In Labor Force | Age 25-29 Correlation Summary
| Measurement | Cypriot | Nonimmigrants |
| Minimum | 57.1% | 72.6% |
| Maximum | 100.0% | 93.2% |
| Range | 42.9% | 20.6% |
| Mean | 86.9% | 83.4% |
| Median | 86.5% | 83.9% |
| Interquartile 25% (IQ1) | 84.6% | 82.3% |
| Interquartile 75% (IQ3) | 93.3% | 84.8% |
| Interquartile Range (IQR) | 8.7% | 2.5% |
| Standard Deviation (Sample) | 8.4% | 2.8% |
| Standard Deviation (Population) | 8.3% | 2.8% |
Similar Demographics by In Labor Force | Age 25-29
Demographics Similar to Cypriots by In Labor Force | Age 25-29
In terms of in labor force | age 25-29, the demographic groups most similar to Cypriots are Immigrants from Nepal (85.8%, a difference of 0.0%), Lithuanian (85.8%, a difference of 0.010%), Polish (85.8%, a difference of 0.030%), German Russian (85.8%, a difference of 0.040%), and Slovak (85.8%, a difference of 0.040%).
| Demographics | Rating | Rank | In Labor Force | Age 25-29 |
| Ugandans | 100.0 /100 | #28 | Exceptional 85.9% |
| Immigrants | Liberia | 100.0 /100 | #29 | Exceptional 85.9% |
| Immigrants | Serbia | 100.0 /100 | #30 | Exceptional 85.9% |
| German Russians | 100.0 /100 | #31 | Exceptional 85.8% |
| Slovaks | 100.0 /100 | #32 | Exceptional 85.8% |
| Immigrants | Bulgaria | 100.0 /100 | #33 | Exceptional 85.8% |
| Lithuanians | 99.9 /100 | #34 | Exceptional 85.8% |
| Cypriots | 99.9 /100 | #35 | Exceptional 85.8% |
| Immigrants | Nepal | 99.9 /100 | #36 | Exceptional 85.8% |
| Poles | 99.9 /100 | #37 | Exceptional 85.8% |
| Sierra Leoneans | 99.9 /100 | #38 | Exceptional 85.8% |
| Croatians | 99.9 /100 | #39 | Exceptional 85.8% |
| Immigrants | Albania | 99.9 /100 | #40 | Exceptional 85.7% |
| Immigrants | Greece | 99.9 /100 | #41 | Exceptional 85.7% |
| Immigrants | Eritrea | 99.9 /100 | #42 | Exceptional 85.7% |
Demographics Similar to Nonimmigrants by In Labor Force | Age 25-29
In terms of in labor force | age 25-29, the demographic groups most similar to Nonimmigrants are Hmong (83.7%, a difference of 0.010%), Immigrants from El Salvador (83.7%, a difference of 0.020%), Cree (83.8%, a difference of 0.030%), Central American (83.7%, a difference of 0.030%), and Bahamian (83.7%, a difference of 0.040%).
| Demographics | Rating | Rank | In Labor Force | Age 25-29 |
| Alsatians | 0.7 /100 | #241 | Tragic 83.9% |
| U.S. Virgin Islanders | 0.6 /100 | #242 | Tragic 83.8% |
| Salvadorans | 0.5 /100 | #243 | Tragic 83.8% |
| Immigrants | Jamaica | 0.4 /100 | #244 | Tragic 83.8% |
| Iroquois | 0.4 /100 | #245 | Tragic 83.8% |
| Cree | 0.3 /100 | #246 | Tragic 83.8% |
| Immigrants | El Salvador | 0.3 /100 | #247 | Tragic 83.7% |
| Immigrants | Nonimmigrants | 0.3 /100 | #248 | Tragic 83.7% |
| Hmong | 0.3 /100 | #249 | Tragic 83.7% |
| Central Americans | 0.2 /100 | #250 | Tragic 83.7% |
| Bahamians | 0.2 /100 | #251 | Tragic 83.7% |
| Guatemalans | 0.2 /100 | #252 | Tragic 83.7% |
| Immigrants | Trinidad and Tobago | 0.2 /100 | #253 | Tragic 83.7% |
| Spaniards | 0.2 /100 | #254 | Tragic 83.7% |
| Haitians | 0.2 /100 | #255 | Tragic 83.7% |