Cypriot vs Immigrants from Croatia 6th Grade
COMPARE
Cypriot
Immigrants from Croatia
6th Grade
6th Grade Comparison
Cypriots
Immigrants from Croatia
97.5%
6TH GRADE
98.7/ 100
METRIC RATING
94th/ 347
METRIC RANK
97.3%
6TH GRADE
93.1/ 100
METRIC RATING
127th/ 347
METRIC RANK
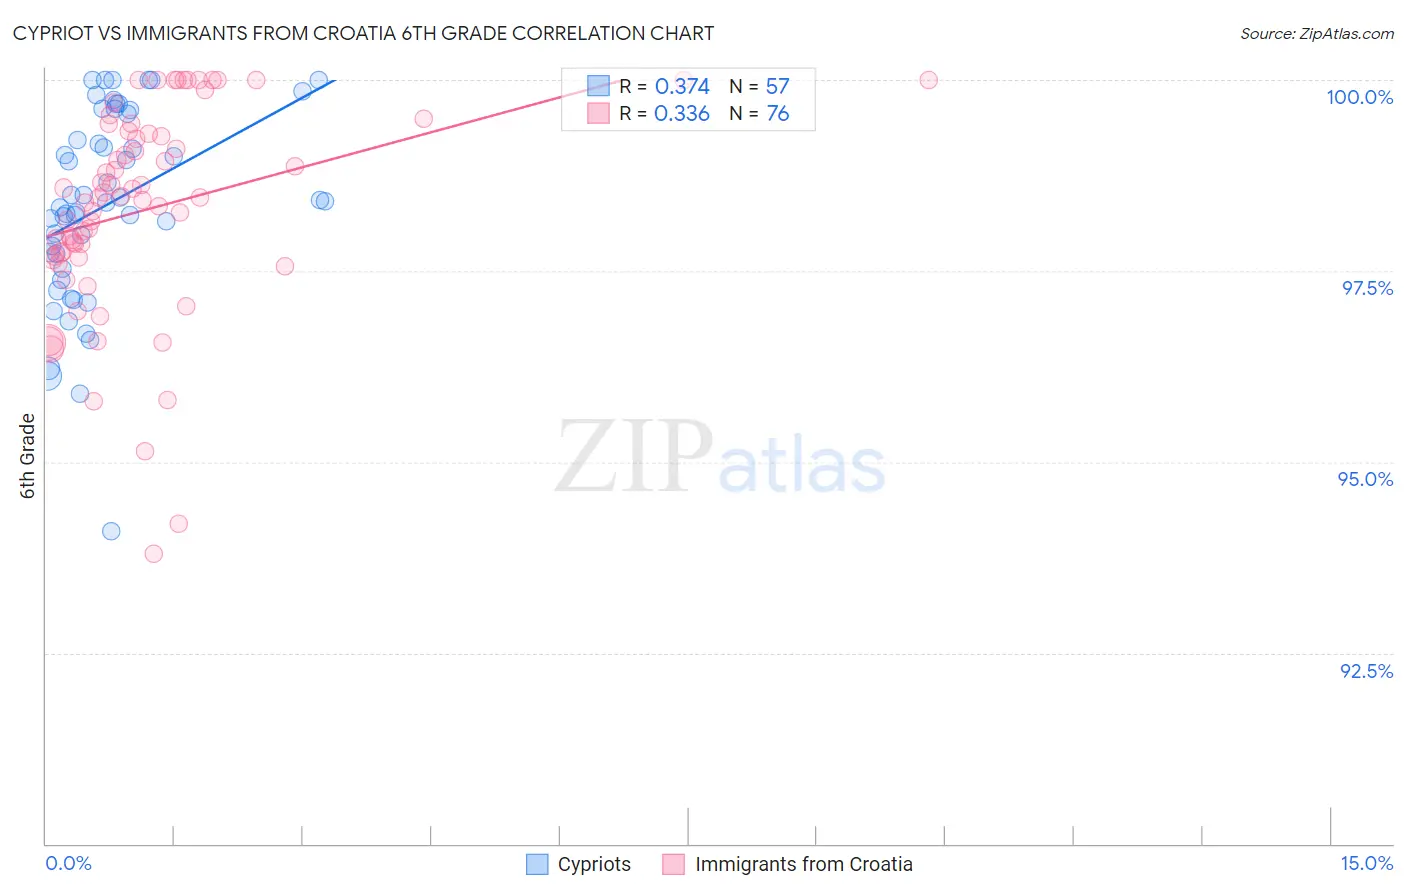
Cypriot vs Immigrants from Croatia 6th Grade Correlation Chart
The statistical analysis conducted on geographies consisting of 61,870,289 people shows a mild positive correlation between the proportion of Cypriots and percentage of population with at least 6th grade education in the United States with a correlation coefficient (R) of 0.374 and weighted average of 97.5%. Similarly, the statistical analysis conducted on geographies consisting of 132,547,821 people shows a mild positive correlation between the proportion of Immigrants from Croatia and percentage of population with at least 6th grade education in the United States with a correlation coefficient (R) of 0.336 and weighted average of 97.3%, a difference of 0.19%.
6th Grade Correlation Summary
| Measurement | Cypriot | Immigrants from Croatia |
| Minimum | 94.1% | 93.8% |
| Maximum | 100.0% | 100.0% |
| Range | 5.9% | 6.2% |
| Mean | 98.4% | 98.3% |
| Median | 98.4% | 98.5% |
| Interquartile 25% (IQ1) | 97.6% | 97.7% |
| Interquartile 75% (IQ3) | 99.6% | 99.3% |
| Interquartile Range (IQR) | 2.0% | 1.6% |
| Standard Deviation (Sample) | 1.3% | 1.4% |
| Standard Deviation (Population) | 1.3% | 1.4% |
Similar Demographics by 6th Grade
Demographics Similar to Cypriots by 6th Grade
In terms of 6th grade, the demographic groups most similar to Cypriots are Romanian (97.5%, a difference of 0.0%), Cree (97.5%, a difference of 0.0%), Immigrants from Ireland (97.5%, a difference of 0.0%), Immigrants from Germany (97.5%, a difference of 0.0%), and Immigrants from Sweden (97.5%, a difference of 0.0%).
| Demographics | Rating | Rank | 6th Grade |
| Puget Sound Salish | 98.9 /100 | #87 | Exceptional 97.5% |
| Immigrants | South Africa | 98.9 /100 | #88 | Exceptional 97.5% |
| Immigrants | Australia | 98.8 /100 | #89 | Exceptional 97.5% |
| Pueblo | 98.8 /100 | #90 | Exceptional 97.5% |
| Immigrants | Western Europe | 98.8 /100 | #91 | Exceptional 97.5% |
| Romanians | 98.7 /100 | #92 | Exceptional 97.5% |
| Cree | 98.7 /100 | #93 | Exceptional 97.5% |
| Cypriots | 98.7 /100 | #94 | Exceptional 97.5% |
| Immigrants | Ireland | 98.7 /100 | #95 | Exceptional 97.5% |
| Immigrants | Germany | 98.6 /100 | #96 | Exceptional 97.5% |
| Immigrants | Sweden | 98.6 /100 | #97 | Exceptional 97.5% |
| Immigrants | Denmark | 98.5 /100 | #98 | Exceptional 97.5% |
| Yugoslavians | 98.5 /100 | #99 | Exceptional 97.5% |
| Turks | 98.3 /100 | #100 | Exceptional 97.5% |
| South Africans | 98.2 /100 | #101 | Exceptional 97.5% |
Demographics Similar to Immigrants from Croatia by 6th Grade
In terms of 6th grade, the demographic groups most similar to Immigrants from Croatia are Spanish (97.3%, a difference of 0.010%), Immigrants from Bulgaria (97.3%, a difference of 0.010%), Hmong (97.4%, a difference of 0.020%), Okinawan (97.4%, a difference of 0.020%), and Immigrants from Romania (97.3%, a difference of 0.020%).
| Demographics | Rating | Rank | 6th Grade |
| Syrians | 94.8 /100 | #120 | Exceptional 97.4% |
| Immigrants | Norway | 94.7 /100 | #121 | Exceptional 97.4% |
| Immigrants | France | 94.5 /100 | #122 | Exceptional 97.4% |
| Hmong | 94.4 /100 | #123 | Exceptional 97.4% |
| Okinawans | 94.2 /100 | #124 | Exceptional 97.4% |
| Spanish | 93.7 /100 | #125 | Exceptional 97.3% |
| Immigrants | Bulgaria | 93.6 /100 | #126 | Exceptional 97.3% |
| Immigrants | Croatia | 93.1 /100 | #127 | Exceptional 97.3% |
| Immigrants | Romania | 92.0 /100 | #128 | Exceptional 97.3% |
| Immigrants | Serbia | 91.9 /100 | #129 | Exceptional 97.3% |
| Cambodians | 91.8 /100 | #130 | Exceptional 97.3% |
| Immigrants | Europe | 91.1 /100 | #131 | Exceptional 97.3% |
| Palestinians | 90.9 /100 | #132 | Exceptional 97.3% |
| Immigrants | Moldova | 90.0 /100 | #133 | Excellent 97.3% |
| Immigrants | Kuwait | 89.5 /100 | #134 | Excellent 97.3% |