Immigrants from Canada vs Iroquois Ambulatory Disability
COMPARE
Immigrants from Canada
Iroquois
Ambulatory Disability
Ambulatory Disability Comparison
Immigrants from Canada
Iroquois
6.1%
AMBULATORY DISABILITY
50.0/ 100
METRIC RATING
174th/ 347
METRIC RANK
7.1%
AMBULATORY DISABILITY
0.0/ 100
METRIC RATING
306th/ 347
METRIC RANK
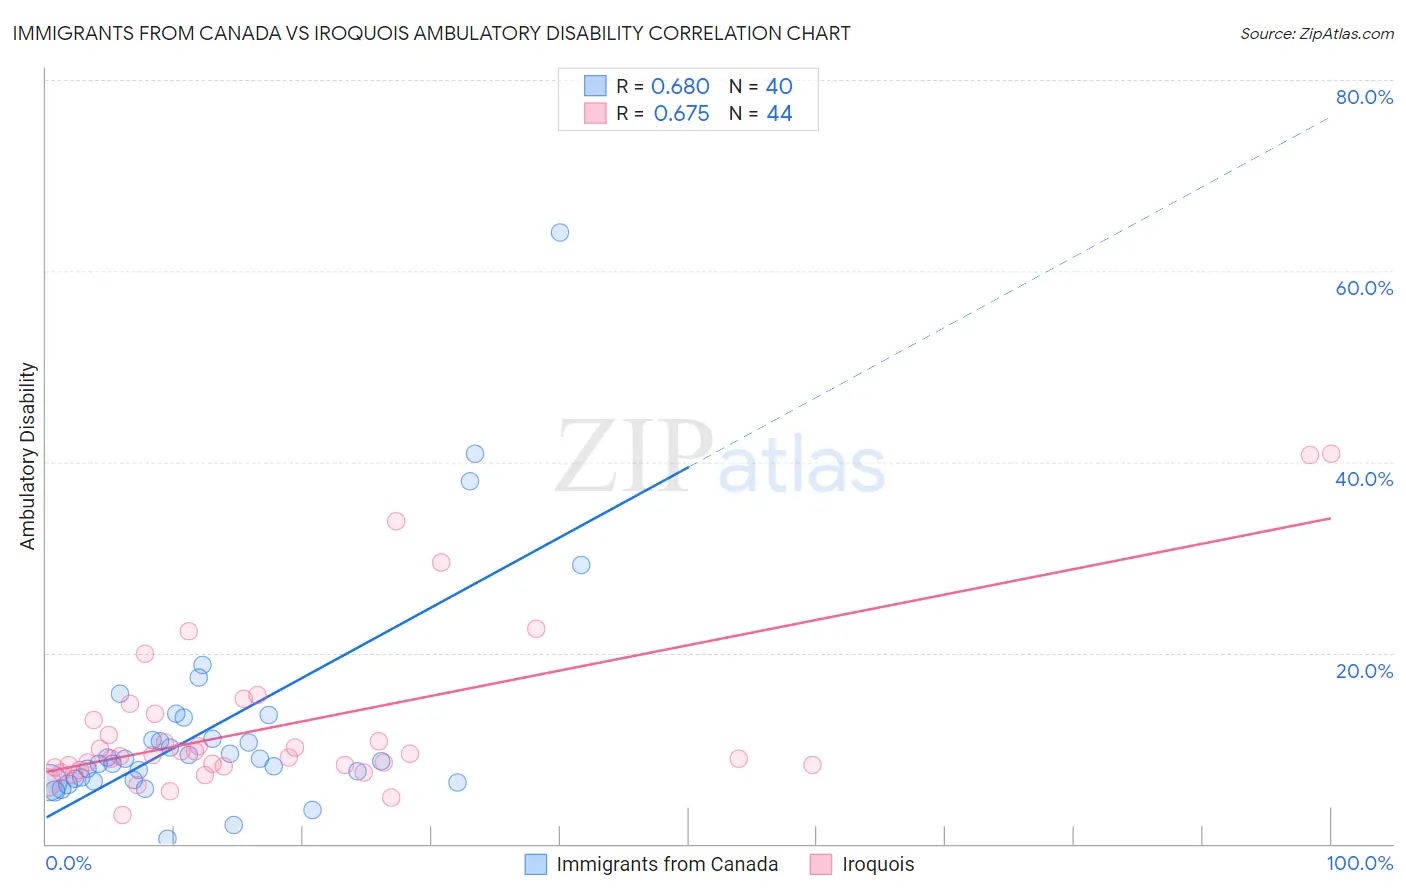
Immigrants from Canada vs Iroquois Ambulatory Disability Correlation Chart
The statistical analysis conducted on geographies consisting of 459,245,879 people shows a significant positive correlation between the proportion of Immigrants from Canada and percentage of population with ambulatory disability in the United States with a correlation coefficient (R) of 0.680 and weighted average of 6.1%. Similarly, the statistical analysis conducted on geographies consisting of 207,272,935 people shows a significant positive correlation between the proportion of Iroquois and percentage of population with ambulatory disability in the United States with a correlation coefficient (R) of 0.675 and weighted average of 7.1%, a difference of 15.3%.
Ambulatory Disability Correlation Summary
| Measurement | Immigrants from Canada | Iroquois |
| Minimum | 0.55% | 3.0% |
| Maximum | 64.0% | 40.9% |
| Range | 63.4% | 37.9% |
| Mean | 12.2% | 12.5% |
| Median | 8.8% | 9.2% |
| Interquartile 25% (IQ1) | 6.6% | 8.0% |
| Interquartile 75% (IQ3) | 12.1% | 13.3% |
| Interquartile Range (IQR) | 5.5% | 5.2% |
| Standard Deviation (Sample) | 11.8% | 8.7% |
| Standard Deviation (Population) | 11.6% | 8.6% |
Similar Demographics by Ambulatory Disability
Demographics Similar to Immigrants from Canada by Ambulatory Disability
In terms of ambulatory disability, the demographic groups most similar to Immigrants from Canada are Croatian (6.1%, a difference of 0.060%), Immigrants from Burma/Myanmar (6.1%, a difference of 0.11%), Moroccan (6.1%, a difference of 0.14%), Vietnamese (6.1%, a difference of 0.15%), and Immigrants from Ecuador (6.1%, a difference of 0.20%).
| Demographics | Rating | Rank | Ambulatory Disability |
| Immigrants | Oceania | 60.7 /100 | #167 | Good 6.1% |
| Ecuadorians | 60.5 /100 | #168 | Good 6.1% |
| Immigrants | Southern Europe | 58.1 /100 | #169 | Average 6.1% |
| Immigrants | Ecuador | 53.8 /100 | #170 | Average 6.1% |
| Moroccans | 52.6 /100 | #171 | Average 6.1% |
| Immigrants | Burma/Myanmar | 52.2 /100 | #172 | Average 6.1% |
| Croatians | 51.2 /100 | #173 | Average 6.1% |
| Immigrants | Canada | 50.0 /100 | #174 | Average 6.1% |
| Vietnamese | 47.2 /100 | #175 | Average 6.1% |
| Immigrants | North America | 45.6 /100 | #176 | Average 6.1% |
| Immigrants | England | 45.4 /100 | #177 | Average 6.1% |
| Scandinavians | 44.5 /100 | #178 | Average 6.1% |
| Austrians | 44.1 /100 | #179 | Average 6.1% |
| Immigrants | Nicaragua | 43.9 /100 | #180 | Average 6.1% |
| Swiss | 43.1 /100 | #181 | Average 6.1% |
Demographics Similar to Iroquois by Ambulatory Disability
In terms of ambulatory disability, the demographic groups most similar to Iroquois are Spanish American (7.1%, a difference of 0.26%), Chippewa (7.1%, a difference of 0.27%), Immigrants from the Azores (7.1%, a difference of 0.44%), Immigrants from Micronesia (7.0%, a difference of 0.53%), and Arapaho (7.1%, a difference of 0.72%).
| Demographics | Rating | Rank | Ambulatory Disability |
| Puget Sound Salish | 0.0 /100 | #299 | Tragic 6.9% |
| Marshallese | 0.0 /100 | #300 | Tragic 6.9% |
| British West Indians | 0.0 /100 | #301 | Tragic 7.0% |
| Immigrants | Armenia | 0.0 /100 | #302 | Tragic 7.0% |
| Africans | 0.0 /100 | #303 | Tragic 7.0% |
| Immigrants | Cabo Verde | 0.0 /100 | #304 | Tragic 7.0% |
| Immigrants | Micronesia | 0.0 /100 | #305 | Tragic 7.0% |
| Iroquois | 0.0 /100 | #306 | Tragic 7.1% |
| Spanish Americans | 0.0 /100 | #307 | Tragic 7.1% |
| Chippewa | 0.0 /100 | #308 | Tragic 7.1% |
| Immigrants | Azores | 0.0 /100 | #309 | Tragic 7.1% |
| Arapaho | 0.0 /100 | #310 | Tragic 7.1% |
| Cree | 0.0 /100 | #311 | Tragic 7.1% |
| Delaware | 0.0 /100 | #312 | Tragic 7.1% |
| Immigrants | Yemen | 0.0 /100 | #313 | Tragic 7.1% |