Cuban vs Immigrants from Albania 5th Grade
COMPARE
Cuban
Immigrants from Albania
5th Grade
5th Grade Comparison
Cubans
Immigrants from Albania
96.6%
5TH GRADE
0.1/ 100
METRIC RATING
276th/ 347
METRIC RANK
97.2%
5TH GRADE
28.5/ 100
METRIC RATING
194th/ 347
METRIC RANK
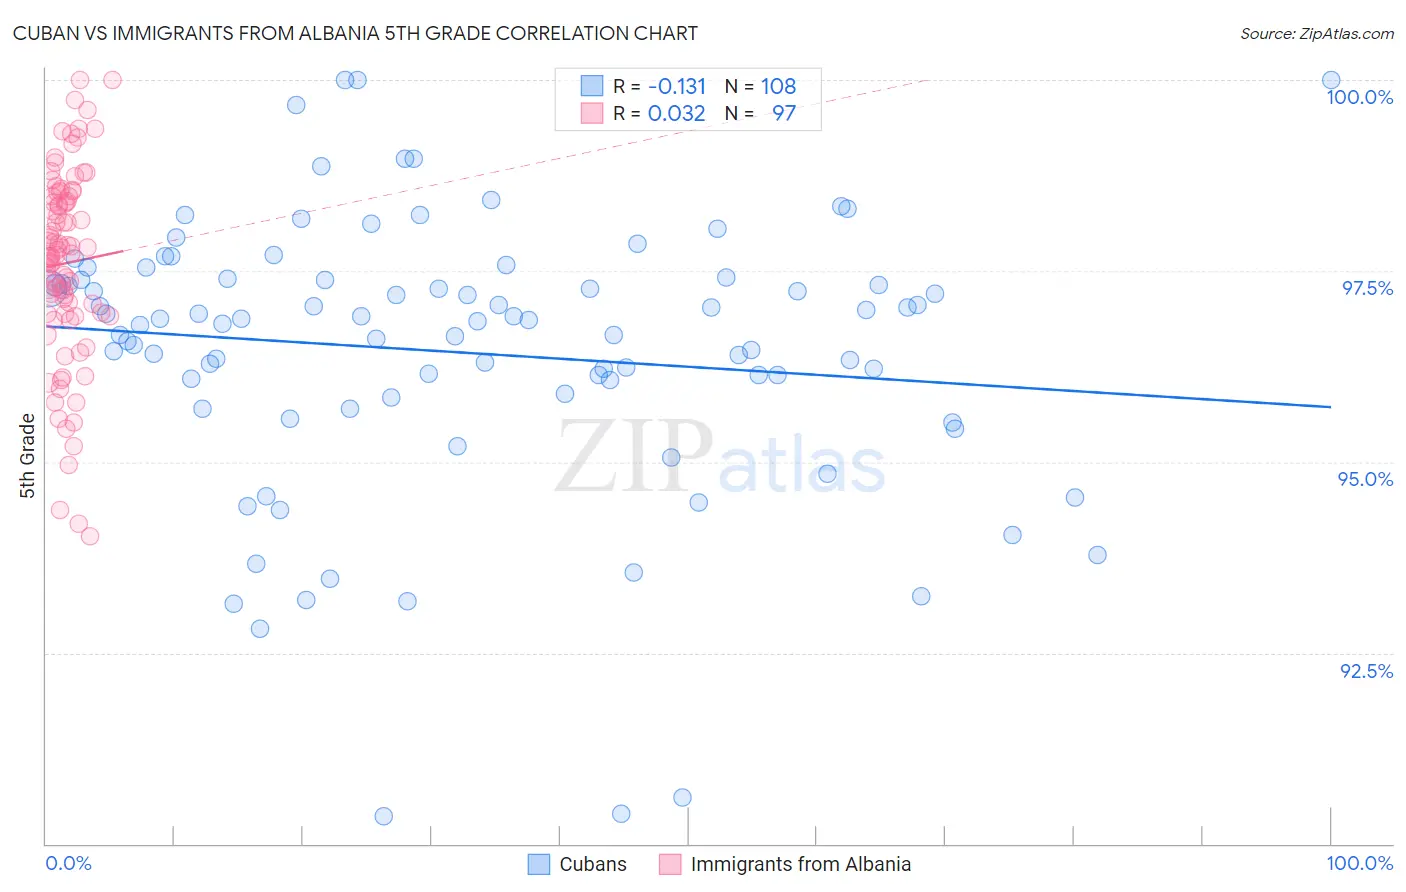
Cuban vs Immigrants from Albania 5th Grade Correlation Chart
The statistical analysis conducted on geographies consisting of 449,326,865 people shows a poor negative correlation between the proportion of Cubans and percentage of population with at least 5th grade education in the United States with a correlation coefficient (R) of -0.131 and weighted average of 96.6%. Similarly, the statistical analysis conducted on geographies consisting of 119,265,453 people shows no correlation between the proportion of Immigrants from Albania and percentage of population with at least 5th grade education in the United States with a correlation coefficient (R) of 0.032 and weighted average of 97.2%, a difference of 0.61%.
5th Grade Correlation Summary
| Measurement | Cuban | Immigrants from Albania |
| Minimum | 90.4% | 94.0% |
| Maximum | 100.0% | 100.0% |
| Range | 9.6% | 6.0% |
| Mean | 96.4% | 97.6% |
| Median | 96.9% | 97.7% |
| Interquartile 25% (IQ1) | 95.9% | 96.9% |
| Interquartile 75% (IQ3) | 97.4% | 98.5% |
| Interquartile Range (IQR) | 1.5% | 1.5% |
| Standard Deviation (Sample) | 1.8% | 1.3% |
| Standard Deviation (Population) | 1.8% | 1.2% |
Similar Demographics by 5th Grade
Demographics Similar to Cubans by 5th Grade
In terms of 5th grade, the demographic groups most similar to Cubans are Immigrants from Peru (96.6%, a difference of 0.0%), Immigrants from Bolivia (96.6%, a difference of 0.0%), Yaqui (96.7%, a difference of 0.010%), Immigrants from Cameroon (96.7%, a difference of 0.010%), and Immigrants from Ghana (96.6%, a difference of 0.010%).
| Demographics | Rating | Rank | 5th Grade |
| Ghanaians | 0.2 /100 | #269 | Tragic 96.7% |
| Afghans | 0.2 /100 | #270 | Tragic 96.7% |
| Immigrants | Hong Kong | 0.2 /100 | #271 | Tragic 96.7% |
| Trinidadians and Tobagonians | 0.1 /100 | #272 | Tragic 96.7% |
| Yaqui | 0.1 /100 | #273 | Tragic 96.7% |
| Immigrants | Cameroon | 0.1 /100 | #274 | Tragic 96.7% |
| Immigrants | Peru | 0.1 /100 | #275 | Tragic 96.6% |
| Cubans | 0.1 /100 | #276 | Tragic 96.6% |
| Immigrants | Bolivia | 0.1 /100 | #277 | Tragic 96.6% |
| Immigrants | Ghana | 0.1 /100 | #278 | Tragic 96.6% |
| Immigrants | Philippines | 0.1 /100 | #279 | Tragic 96.6% |
| Immigrants | Western Africa | 0.1 /100 | #280 | Tragic 96.6% |
| Houma | 0.1 /100 | #281 | Tragic 96.6% |
| Barbadians | 0.1 /100 | #282 | Tragic 96.6% |
| Fijians | 0.1 /100 | #283 | Tragic 96.6% |
Demographics Similar to Immigrants from Albania by 5th Grade
In terms of 5th grade, the demographic groups most similar to Immigrants from Albania are Navajo (97.2%, a difference of 0.0%), Immigrants from Brazil (97.3%, a difference of 0.010%), Panamanian (97.3%, a difference of 0.010%), Guamanian/Chamorro (97.2%, a difference of 0.010%), and Immigrants from Egypt (97.3%, a difference of 0.020%).
| Demographics | Rating | Rank | 5th Grade |
| Spanish Americans | 34.7 /100 | #187 | Fair 97.3% |
| Paraguayans | 33.7 /100 | #188 | Fair 97.3% |
| Immigrants | Egypt | 32.9 /100 | #189 | Fair 97.3% |
| Blacks/African Americans | 31.8 /100 | #190 | Fair 97.3% |
| Immigrants | Brazil | 31.5 /100 | #191 | Fair 97.3% |
| Panamanians | 31.3 /100 | #192 | Fair 97.3% |
| Navajo | 29.0 /100 | #193 | Fair 97.2% |
| Immigrants | Albania | 28.5 /100 | #194 | Fair 97.2% |
| Guamanians/Chamorros | 26.8 /100 | #195 | Fair 97.2% |
| Hawaiians | 25.6 /100 | #196 | Fair 97.2% |
| Brazilians | 25.4 /100 | #197 | Fair 97.2% |
| Immigrants | Uganda | 21.1 /100 | #198 | Fair 97.2% |
| Natives/Alaskans | 18.0 /100 | #199 | Poor 97.2% |
| Immigrants | Northern Africa | 16.8 /100 | #200 | Poor 97.2% |
| Immigrants | Chile | 16.6 /100 | #201 | Poor 97.2% |