Cuban vs Hispanic or Latino In Labor Force | Age > 16
COMPARE
Cuban
Hispanic or Latino
In Labor Force | Age > 16
In Labor Force | Age > 16 Comparison
Cubans
Hispanics or Latinos
64.2%
IN LABOR FORCE | AGE > 16
0.5/ 100
METRIC RATING
265th/ 347
METRIC RANK
64.3%
IN LABOR FORCE | AGE > 16
1.1/ 100
METRIC RATING
255th/ 347
METRIC RANK
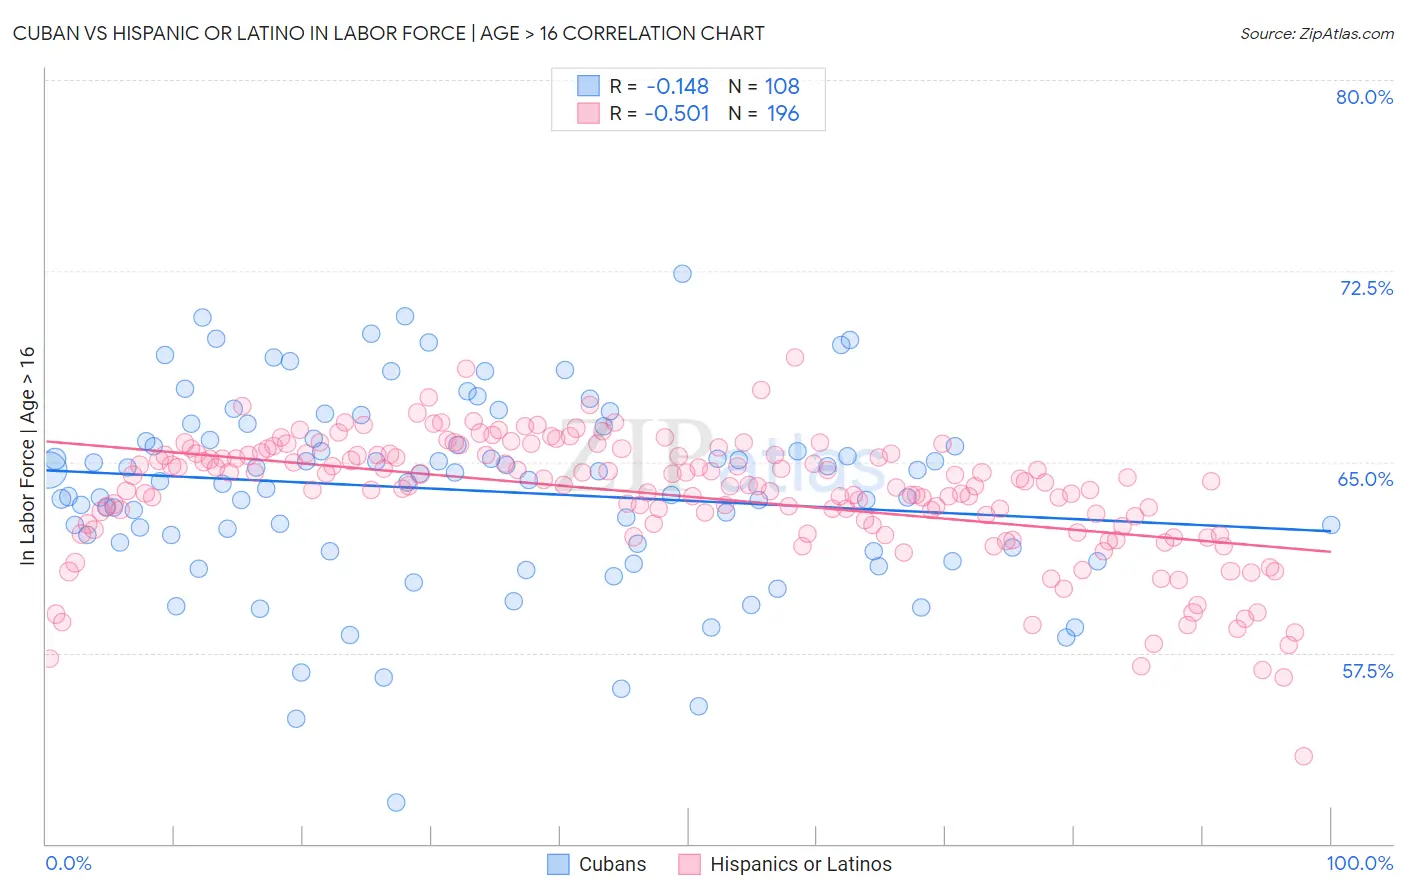
Cuban vs Hispanic or Latino In Labor Force | Age > 16 Correlation Chart
The statistical analysis conducted on geographies consisting of 449,375,303 people shows a poor negative correlation between the proportion of Cubans and labor force participation rate among population ages 16 and over in the United States with a correlation coefficient (R) of -0.148 and weighted average of 64.2%. Similarly, the statistical analysis conducted on geographies consisting of 574,025,710 people shows a substantial negative correlation between the proportion of Hispanics or Latinos and labor force participation rate among population ages 16 and over in the United States with a correlation coefficient (R) of -0.501 and weighted average of 64.3%, a difference of 0.22%.
In Labor Force | Age > 16 Correlation Summary
| Measurement | Cuban | Hispanic or Latino |
| Minimum | 51.6% | 53.4% |
| Maximum | 72.4% | 69.1% |
| Range | 20.8% | 15.7% |
| Mean | 63.9% | 63.7% |
| Median | 64.3% | 64.1% |
| Interquartile 25% (IQ1) | 61.7% | 62.5% |
| Interquartile 75% (IQ3) | 65.9% | 65.3% |
| Interquartile Range (IQR) | 4.2% | 2.8% |
| Standard Deviation (Sample) | 3.7% | 2.5% |
| Standard Deviation (Population) | 3.7% | 2.5% |
Demographics Similar to Cubans and Hispanics or Latinos by In Labor Force | Age > 16
In terms of in labor force | age > 16, the demographic groups most similar to Cubans are Immigrants from England (64.2%, a difference of 0.010%), Canadian (64.1%, a difference of 0.020%), Spaniard (64.1%, a difference of 0.020%), Dutch (64.2%, a difference of 0.040%), and Bahamian (64.2%, a difference of 0.060%). Similarly, the demographic groups most similar to Hispanics or Latinos are Immigrants from Mexico (64.3%, a difference of 0.040%), Immigrants from Uzbekistan (64.3%, a difference of 0.070%), Immigrants from Dominican Republic (64.4%, a difference of 0.080%), Czechoslovakian (64.3%, a difference of 0.080%), and Inupiat (64.3%, a difference of 0.080%).
| Demographics | Rating | Rank | In Labor Force | Age > 16 |
| British West Indians | 1.8 /100 | #250 | Tragic 64.4% |
| Portuguese | 1.6 /100 | #251 | Tragic 64.4% |
| Immigrants | Dominican Republic | 1.5 /100 | #252 | Tragic 64.4% |
| Czechoslovakians | 1.4 /100 | #253 | Tragic 64.3% |
| Immigrants | Uzbekistan | 1.4 /100 | #254 | Tragic 64.3% |
| Hispanics or Latinos | 1.1 /100 | #255 | Tragic 64.3% |
| Immigrants | Mexico | 1.0 /100 | #256 | Tragic 64.3% |
| Inupiat | 0.8 /100 | #257 | Tragic 64.3% |
| Immigrants | Scotland | 0.8 /100 | #258 | Tragic 64.2% |
| Immigrants | Western Europe | 0.7 /100 | #259 | Tragic 64.2% |
| Marshallese | 0.7 /100 | #260 | Tragic 64.2% |
| Basques | 0.7 /100 | #261 | Tragic 64.2% |
| Finns | 0.7 /100 | #262 | Tragic 64.2% |
| Bahamians | 0.6 /100 | #263 | Tragic 64.2% |
| Dutch | 0.6 /100 | #264 | Tragic 64.2% |
| Cubans | 0.5 /100 | #265 | Tragic 64.2% |
| Immigrants | England | 0.5 /100 | #266 | Tragic 64.2% |
| Canadians | 0.5 /100 | #267 | Tragic 64.1% |
| Spaniards | 0.5 /100 | #268 | Tragic 64.1% |
| Irish | 0.4 /100 | #269 | Tragic 64.1% |
| Guyanese | 0.4 /100 | #270 | Tragic 64.1% |