Crow vs Immigrants from Micronesia Disability Age 65 to 74
COMPARE
Crow
Immigrants from Micronesia
Disability Age 65 to 74
Disability Age 65 to 74 Comparison
Crow
Immigrants from Micronesia
27.9%
DISABILITY AGE 65 TO 74
0.0/ 100
METRIC RATING
316th/ 347
METRIC RANK
26.1%
DISABILITY AGE 65 TO 74
0.0/ 100
METRIC RATING
286th/ 347
METRIC RANK
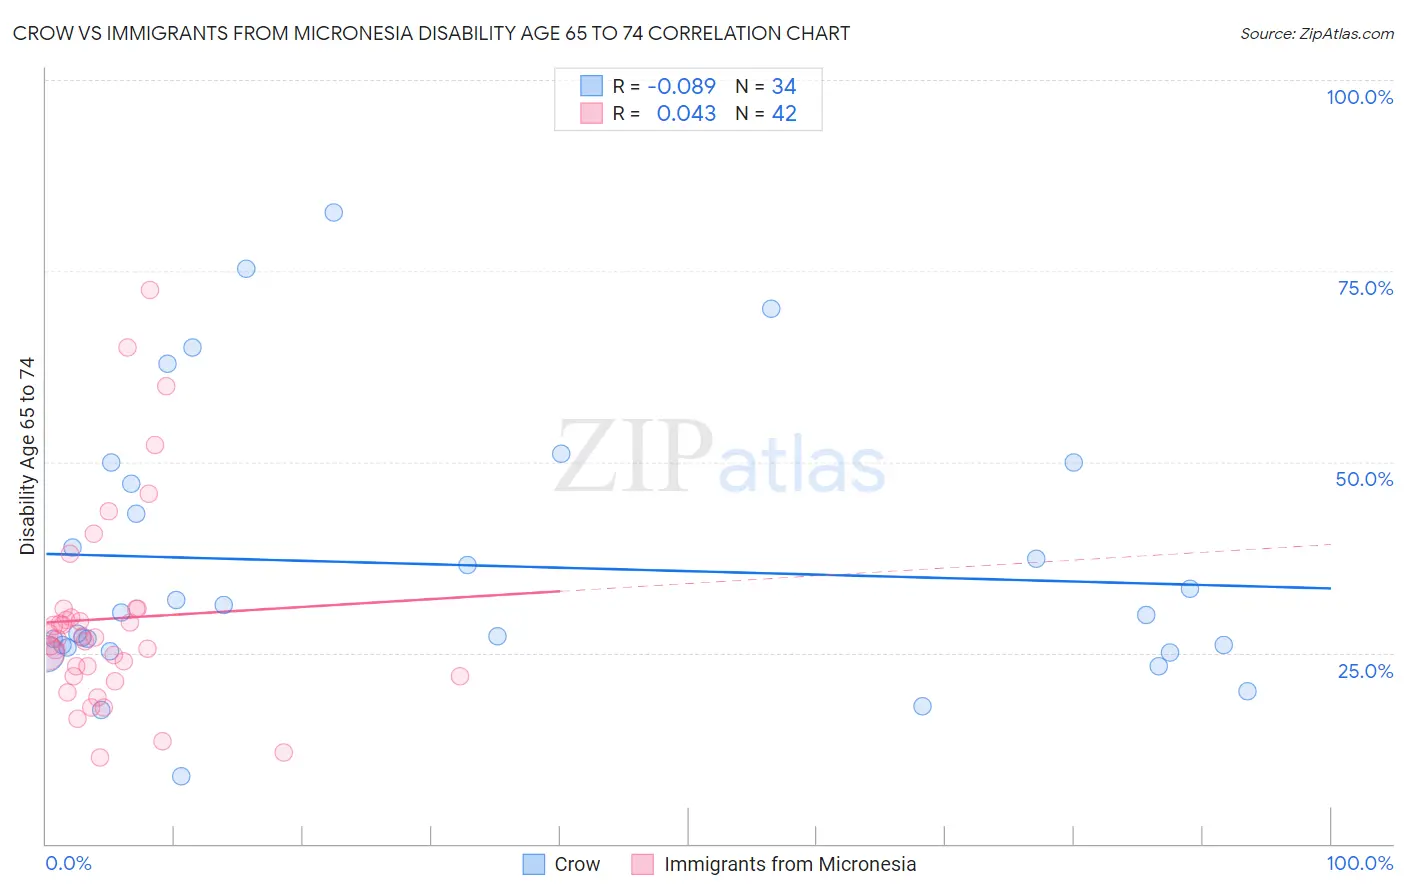
Crow vs Immigrants from Micronesia Disability Age 65 to 74 Correlation Chart
The statistical analysis conducted on geographies consisting of 59,176,380 people shows a slight negative correlation between the proportion of Crow and percentage of population with a disability between the ages 65 and 75 in the United States with a correlation coefficient (R) of -0.089 and weighted average of 27.9%. Similarly, the statistical analysis conducted on geographies consisting of 61,452,747 people shows no correlation between the proportion of Immigrants from Micronesia and percentage of population with a disability between the ages 65 and 75 in the United States with a correlation coefficient (R) of 0.043 and weighted average of 26.1%, a difference of 7.0%.
Disability Age 65 to 74 Correlation Summary
| Measurement | Crow | Immigrants from Micronesia |
| Minimum | 8.8% | 11.3% |
| Maximum | 82.6% | 72.4% |
| Range | 73.8% | 61.1% |
| Mean | 36.5% | 29.5% |
| Median | 30.2% | 27.0% |
| Interquartile 25% (IQ1) | 25.8% | 22.0% |
| Interquartile 75% (IQ3) | 47.2% | 30.8% |
| Interquartile Range (IQR) | 21.4% | 8.8% |
| Standard Deviation (Sample) | 17.6% | 13.2% |
| Standard Deviation (Population) | 17.4% | 13.1% |
Similar Demographics by Disability Age 65 to 74
Demographics Similar to Crow by Disability Age 65 to 74
In terms of disability age 65 to 74, the demographic groups most similar to Crow are Cajun (27.9%, a difference of 0.040%), Immigrants from Armenia (28.0%, a difference of 0.090%), Nepalese (28.0%, a difference of 0.31%), Chippewa (27.8%, a difference of 0.52%), and Paiute (27.8%, a difference of 0.53%).
| Demographics | Rating | Rank | Disability Age 65 to 74 |
| Yaqui | 0.0 /100 | #309 | Tragic 27.4% |
| Shoshone | 0.0 /100 | #310 | Tragic 27.4% |
| Menominee | 0.0 /100 | #311 | Tragic 27.4% |
| Osage | 0.0 /100 | #312 | Tragic 27.5% |
| Paiute | 0.0 /100 | #313 | Tragic 27.8% |
| Chippewa | 0.0 /100 | #314 | Tragic 27.8% |
| Cajuns | 0.0 /100 | #315 | Tragic 27.9% |
| Crow | 0.0 /100 | #316 | Tragic 27.9% |
| Immigrants | Armenia | 0.0 /100 | #317 | Tragic 28.0% |
| Nepalese | 0.0 /100 | #318 | Tragic 28.0% |
| Arapaho | 0.0 /100 | #319 | Tragic 28.1% |
| Cherokee | 0.0 /100 | #320 | Tragic 28.2% |
| Comanche | 0.0 /100 | #321 | Tragic 28.3% |
| Aleuts | 0.0 /100 | #322 | Tragic 28.4% |
| Puerto Ricans | 0.0 /100 | #323 | Tragic 29.1% |
Demographics Similar to Immigrants from Micronesia by Disability Age 65 to 74
In terms of disability age 65 to 74, the demographic groups most similar to Immigrants from Micronesia are Immigrants from Laos (26.1%, a difference of 0.070%), Mexican American Indian (26.2%, a difference of 0.16%), Immigrants from Congo (26.0%, a difference of 0.43%), Immigrants from the Azores (26.0%, a difference of 0.44%), and African (26.2%, a difference of 0.48%).
| Demographics | Rating | Rank | Disability Age 65 to 74 |
| U.S. Virgin Islanders | 0.1 /100 | #279 | Tragic 25.9% |
| Cree | 0.1 /100 | #280 | Tragic 25.9% |
| Immigrants | Honduras | 0.1 /100 | #281 | Tragic 25.9% |
| Delaware | 0.1 /100 | #282 | Tragic 25.9% |
| Spanish Americans | 0.0 /100 | #283 | Tragic 25.9% |
| Immigrants | Azores | 0.0 /100 | #284 | Tragic 26.0% |
| Immigrants | Congo | 0.0 /100 | #285 | Tragic 26.0% |
| Immigrants | Micronesia | 0.0 /100 | #286 | Tragic 26.1% |
| Immigrants | Laos | 0.0 /100 | #287 | Tragic 26.1% |
| Mexican American Indians | 0.0 /100 | #288 | Tragic 26.2% |
| Africans | 0.0 /100 | #289 | Tragic 26.2% |
| Immigrants | Cabo Verde | 0.0 /100 | #290 | Tragic 26.3% |
| Spanish American Indians | 0.0 /100 | #291 | Tragic 26.4% |
| Blackfeet | 0.0 /100 | #292 | Tragic 26.6% |
| Immigrants | Central America | 0.0 /100 | #293 | Tragic 26.6% |