Serbian vs Chippewa Disability Age 35 to 64
COMPARE
Serbian
Chippewa
Disability Age 35 to 64
Disability Age 35 to 64 Comparison
Serbians
Chippewa
11.0%
DISABILITY AGE 35 TO 64
73.6/ 100
METRIC RATING
159th/ 347
METRIC RANK
15.0%
DISABILITY AGE 35 TO 64
0.0/ 100
METRIC RATING
324th/ 347
METRIC RANK
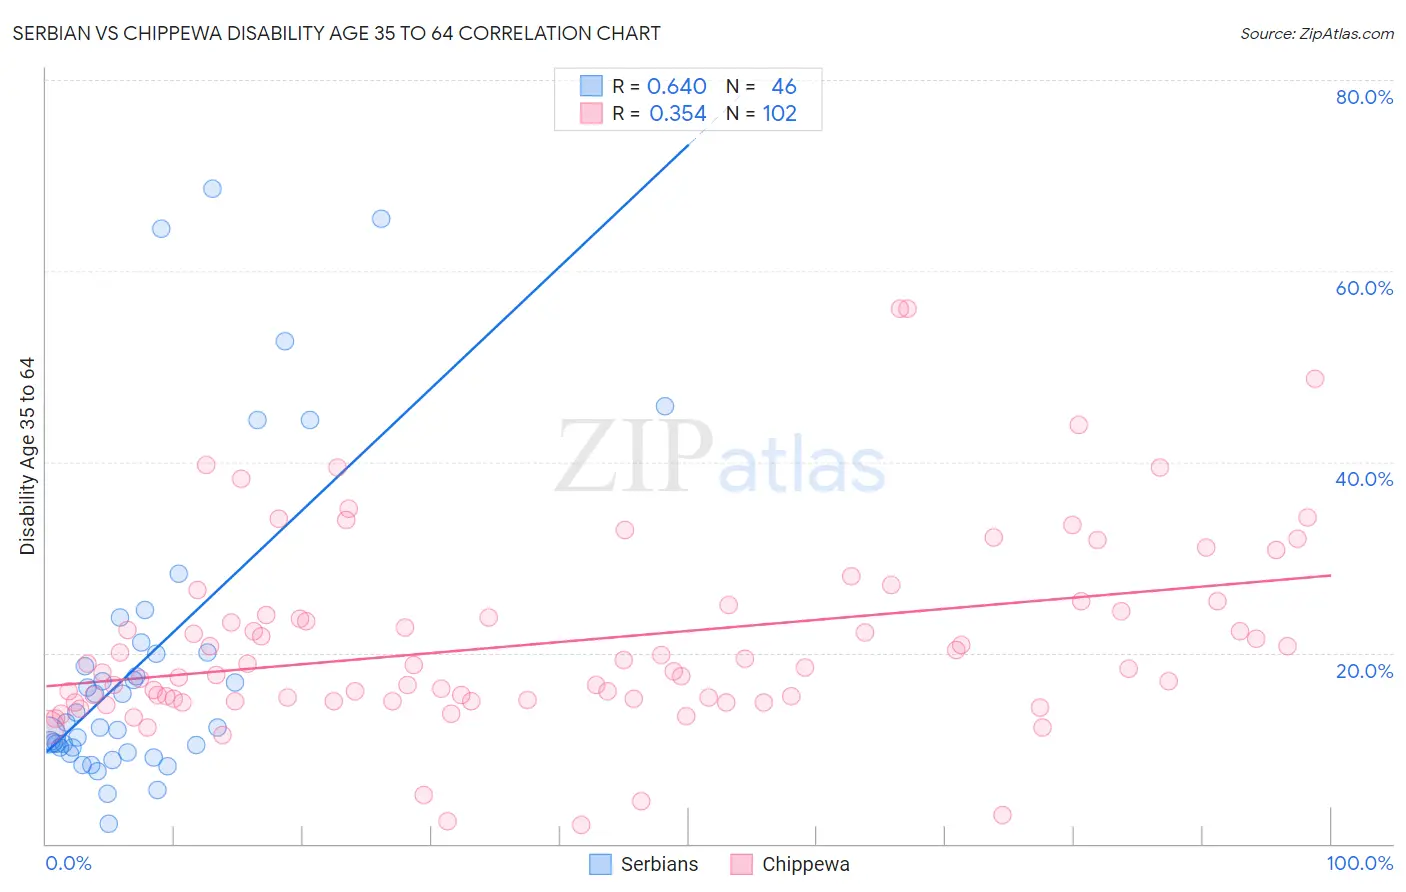
Serbian vs Chippewa Disability Age 35 to 64 Correlation Chart
The statistical analysis conducted on geographies consisting of 267,515,714 people shows a significant positive correlation between the proportion of Serbians and percentage of population with a disability between the ages 34 and 64 in the United States with a correlation coefficient (R) of 0.640 and weighted average of 11.0%. Similarly, the statistical analysis conducted on geographies consisting of 214,987,125 people shows a mild positive correlation between the proportion of Chippewa and percentage of population with a disability between the ages 34 and 64 in the United States with a correlation coefficient (R) of 0.354 and weighted average of 15.0%, a difference of 35.6%.
Disability Age 35 to 64 Correlation Summary
| Measurement | Serbian | Chippewa |
| Minimum | 2.0% | 2.0% |
| Maximum | 68.6% | 56.1% |
| Range | 66.5% | 54.1% |
| Mean | 19.5% | 21.1% |
| Median | 12.4% | 18.4% |
| Interquartile 25% (IQ1) | 10.1% | 15.0% |
| Interquartile 75% (IQ3) | 20.0% | 24.3% |
| Interquartile Range (IQR) | 9.9% | 9.3% |
| Standard Deviation (Sample) | 16.6% | 10.0% |
| Standard Deviation (Population) | 16.4% | 9.9% |
Similar Demographics by Disability Age 35 to 64
Demographics Similar to Serbians by Disability Age 35 to 64
In terms of disability age 35 to 64, the demographic groups most similar to Serbians are Croatian (11.0%, a difference of 0.050%), Immigrants from North America (11.0%, a difference of 0.14%), Guyanese (11.0%, a difference of 0.16%), Immigrants from Sierra Leone (11.0%, a difference of 0.29%), and Moroccan (11.0%, a difference of 0.31%).
| Demographics | Rating | Rank | Disability Age 35 to 64 |
| Ukrainians | 78.0 /100 | #152 | Good 11.0% |
| Immigrants | England | 77.4 /100 | #153 | Good 11.0% |
| Immigrants | Canada | 76.7 /100 | #154 | Good 11.0% |
| Moroccans | 76.4 /100 | #155 | Good 11.0% |
| Immigrants | Sierra Leone | 76.2 /100 | #156 | Good 11.0% |
| Guyanese | 75.1 /100 | #157 | Good 11.0% |
| Immigrants | North America | 74.9 /100 | #158 | Good 11.0% |
| Serbians | 73.6 /100 | #159 | Good 11.0% |
| Croatians | 73.1 /100 | #160 | Good 11.0% |
| Immigrants | Guyana | 70.1 /100 | #161 | Good 11.1% |
| Immigrants | Grenada | 68.4 /100 | #162 | Good 11.1% |
| Immigrants | St. Vincent and the Grenadines | 66.6 /100 | #163 | Good 11.1% |
| Pakistanis | 65.8 /100 | #164 | Good 11.1% |
| Immigrants | Western Europe | 65.2 /100 | #165 | Good 11.1% |
| Immigrants | Haiti | 63.8 /100 | #166 | Good 11.1% |
Demographics Similar to Chippewa by Disability Age 35 to 64
In terms of disability age 35 to 64, the demographic groups most similar to Chippewa are Apache (14.9%, a difference of 0.20%), Arapaho (15.1%, a difference of 0.66%), Potawatomi (14.8%, a difference of 1.4%), Comanche (14.7%, a difference of 1.5%), and Black/African American (14.7%, a difference of 1.7%).
| Demographics | Rating | Rank | Disability Age 35 to 64 |
| Crow | 0.0 /100 | #317 | Tragic 14.6% |
| Ottawa | 0.0 /100 | #318 | Tragic 14.6% |
| Immigrants | Cabo Verde | 0.0 /100 | #319 | Tragic 14.7% |
| Blacks/African Americans | 0.0 /100 | #320 | Tragic 14.7% |
| Comanche | 0.0 /100 | #321 | Tragic 14.7% |
| Potawatomi | 0.0 /100 | #322 | Tragic 14.8% |
| Apache | 0.0 /100 | #323 | Tragic 14.9% |
| Chippewa | 0.0 /100 | #324 | Tragic 15.0% |
| Arapaho | 0.0 /100 | #325 | Tragic 15.1% |
| Natives/Alaskans | 0.0 /100 | #326 | Tragic 15.3% |
| Pueblo | 0.0 /100 | #327 | Tragic 15.3% |
| Cajuns | 0.0 /100 | #328 | Tragic 15.3% |
| Cherokee | 0.0 /100 | #329 | Tragic 15.5% |
| Navajo | 0.0 /100 | #330 | Tragic 15.5% |
| Dutch West Indians | 0.0 /100 | #331 | Tragic 15.6% |