Dominican vs Chippewa Disability Age 35 to 64
COMPARE
Dominican
Chippewa
Disability Age 35 to 64
Disability Age 35 to 64 Comparison
Dominicans
Chippewa
12.9%
DISABILITY AGE 35 TO 64
0.1/ 100
METRIC RATING
275th/ 347
METRIC RANK
15.0%
DISABILITY AGE 35 TO 64
0.0/ 100
METRIC RATING
324th/ 347
METRIC RANK
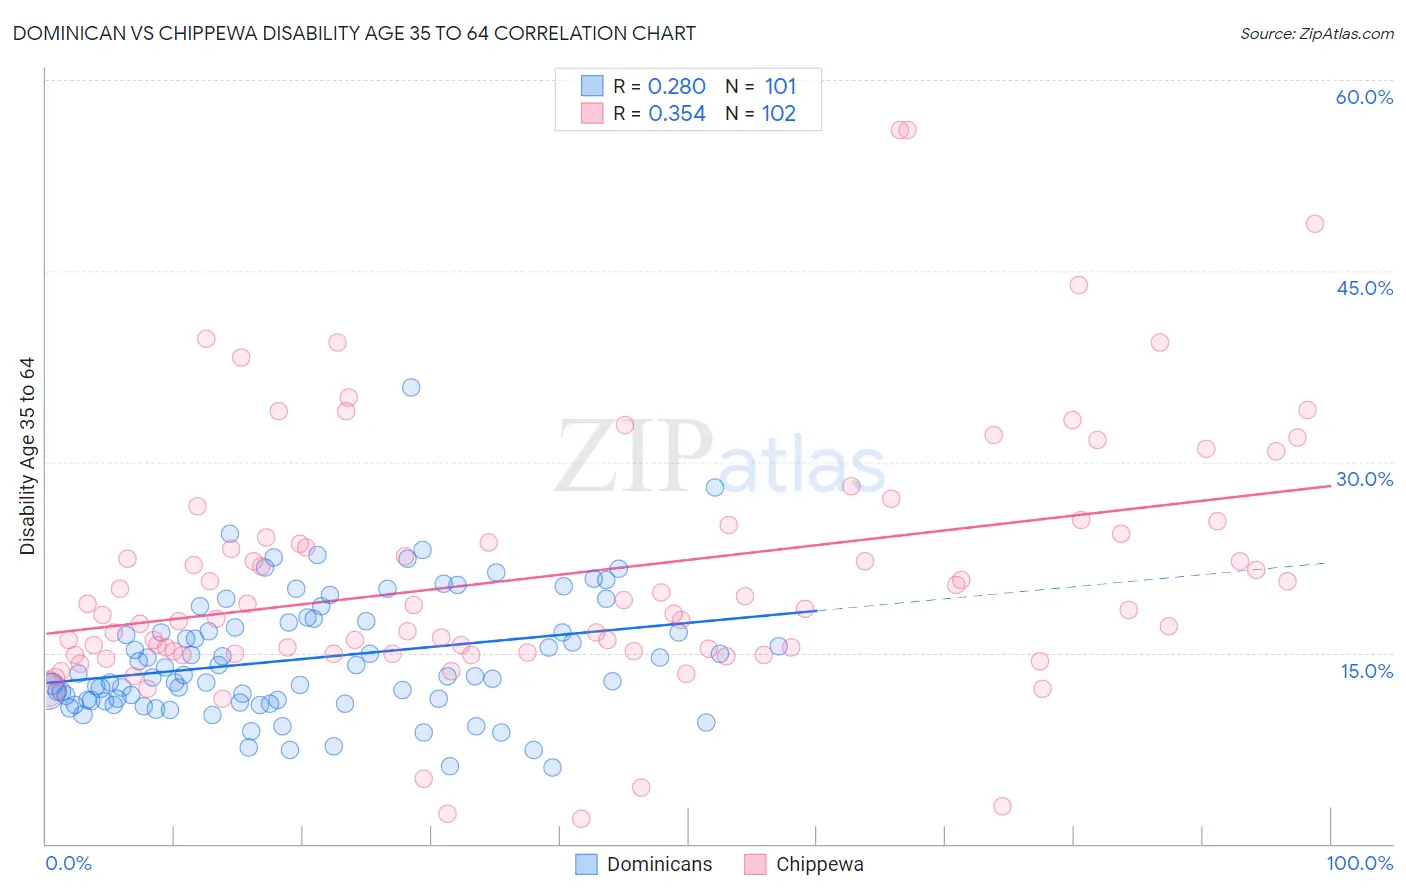
Dominican vs Chippewa Disability Age 35 to 64 Correlation Chart
The statistical analysis conducted on geographies consisting of 354,697,529 people shows a weak positive correlation between the proportion of Dominicans and percentage of population with a disability between the ages 34 and 64 in the United States with a correlation coefficient (R) of 0.280 and weighted average of 12.9%. Similarly, the statistical analysis conducted on geographies consisting of 214,987,125 people shows a mild positive correlation between the proportion of Chippewa and percentage of population with a disability between the ages 34 and 64 in the United States with a correlation coefficient (R) of 0.354 and weighted average of 15.0%, a difference of 16.3%.
Disability Age 35 to 64 Correlation Summary
| Measurement | Dominican | Chippewa |
| Minimum | 6.0% | 2.0% |
| Maximum | 35.9% | 56.1% |
| Range | 29.8% | 54.1% |
| Mean | 14.6% | 21.1% |
| Median | 13.1% | 18.4% |
| Interquartile 25% (IQ1) | 11.2% | 15.0% |
| Interquartile 75% (IQ3) | 17.4% | 24.3% |
| Interquartile Range (IQR) | 6.2% | 9.3% |
| Standard Deviation (Sample) | 4.9% | 10.0% |
| Standard Deviation (Population) | 4.9% | 9.9% |
Similar Demographics by Disability Age 35 to 64
Demographics Similar to Dominicans by Disability Age 35 to 64
In terms of disability age 35 to 64, the demographic groups most similar to Dominicans are Somali (12.9%, a difference of 0.12%), Celtic (12.9%, a difference of 0.14%), Pennsylvania German (12.8%, a difference of 0.16%), U.S. Virgin Islander (12.8%, a difference of 0.25%), and Immigrants from Dominican Republic (12.9%, a difference of 0.31%).
| Demographics | Rating | Rank | Disability Age 35 to 64 |
| Immigrants | Dominica | 0.2 /100 | #268 | Tragic 12.7% |
| Spanish | 0.2 /100 | #269 | Tragic 12.7% |
| French | 0.2 /100 | #270 | Tragic 12.7% |
| Nepalese | 0.1 /100 | #271 | Tragic 12.8% |
| U.S. Virgin Islanders | 0.1 /100 | #272 | Tragic 12.8% |
| Pennsylvania Germans | 0.1 /100 | #273 | Tragic 12.8% |
| Celtics | 0.1 /100 | #274 | Tragic 12.9% |
| Dominicans | 0.1 /100 | #275 | Tragic 12.9% |
| Somalis | 0.1 /100 | #276 | Tragic 12.9% |
| Immigrants | Dominican Republic | 0.1 /100 | #277 | Tragic 12.9% |
| French Canadians | 0.1 /100 | #278 | Tragic 12.9% |
| Immigrants | Micronesia | 0.1 /100 | #279 | Tragic 12.9% |
| Liberians | 0.1 /100 | #280 | Tragic 12.9% |
| Scotch-Irish | 0.1 /100 | #281 | Tragic 13.0% |
| Immigrants | Laos | 0.1 /100 | #282 | Tragic 13.0% |
Demographics Similar to Chippewa by Disability Age 35 to 64
In terms of disability age 35 to 64, the demographic groups most similar to Chippewa are Apache (14.9%, a difference of 0.20%), Arapaho (15.1%, a difference of 0.66%), Potawatomi (14.8%, a difference of 1.4%), Comanche (14.7%, a difference of 1.5%), and Black/African American (14.7%, a difference of 1.7%).
| Demographics | Rating | Rank | Disability Age 35 to 64 |
| Crow | 0.0 /100 | #317 | Tragic 14.6% |
| Ottawa | 0.0 /100 | #318 | Tragic 14.6% |
| Immigrants | Cabo Verde | 0.0 /100 | #319 | Tragic 14.7% |
| Blacks/African Americans | 0.0 /100 | #320 | Tragic 14.7% |
| Comanche | 0.0 /100 | #321 | Tragic 14.7% |
| Potawatomi | 0.0 /100 | #322 | Tragic 14.8% |
| Apache | 0.0 /100 | #323 | Tragic 14.9% |
| Chippewa | 0.0 /100 | #324 | Tragic 15.0% |
| Arapaho | 0.0 /100 | #325 | Tragic 15.1% |
| Natives/Alaskans | 0.0 /100 | #326 | Tragic 15.3% |
| Pueblo | 0.0 /100 | #327 | Tragic 15.3% |
| Cajuns | 0.0 /100 | #328 | Tragic 15.3% |
| Cherokee | 0.0 /100 | #329 | Tragic 15.5% |
| Navajo | 0.0 /100 | #330 | Tragic 15.5% |
| Dutch West Indians | 0.0 /100 | #331 | Tragic 15.6% |