Barbadian vs Chippewa Disability Age 35 to 64
COMPARE
Barbadian
Chippewa
Disability Age 35 to 64
Disability Age 35 to 64 Comparison
Barbadians
Chippewa
11.8%
DISABILITY AGE 35 TO 64
9.5/ 100
METRIC RATING
217th/ 347
METRIC RANK
15.0%
DISABILITY AGE 35 TO 64
0.0/ 100
METRIC RATING
324th/ 347
METRIC RANK
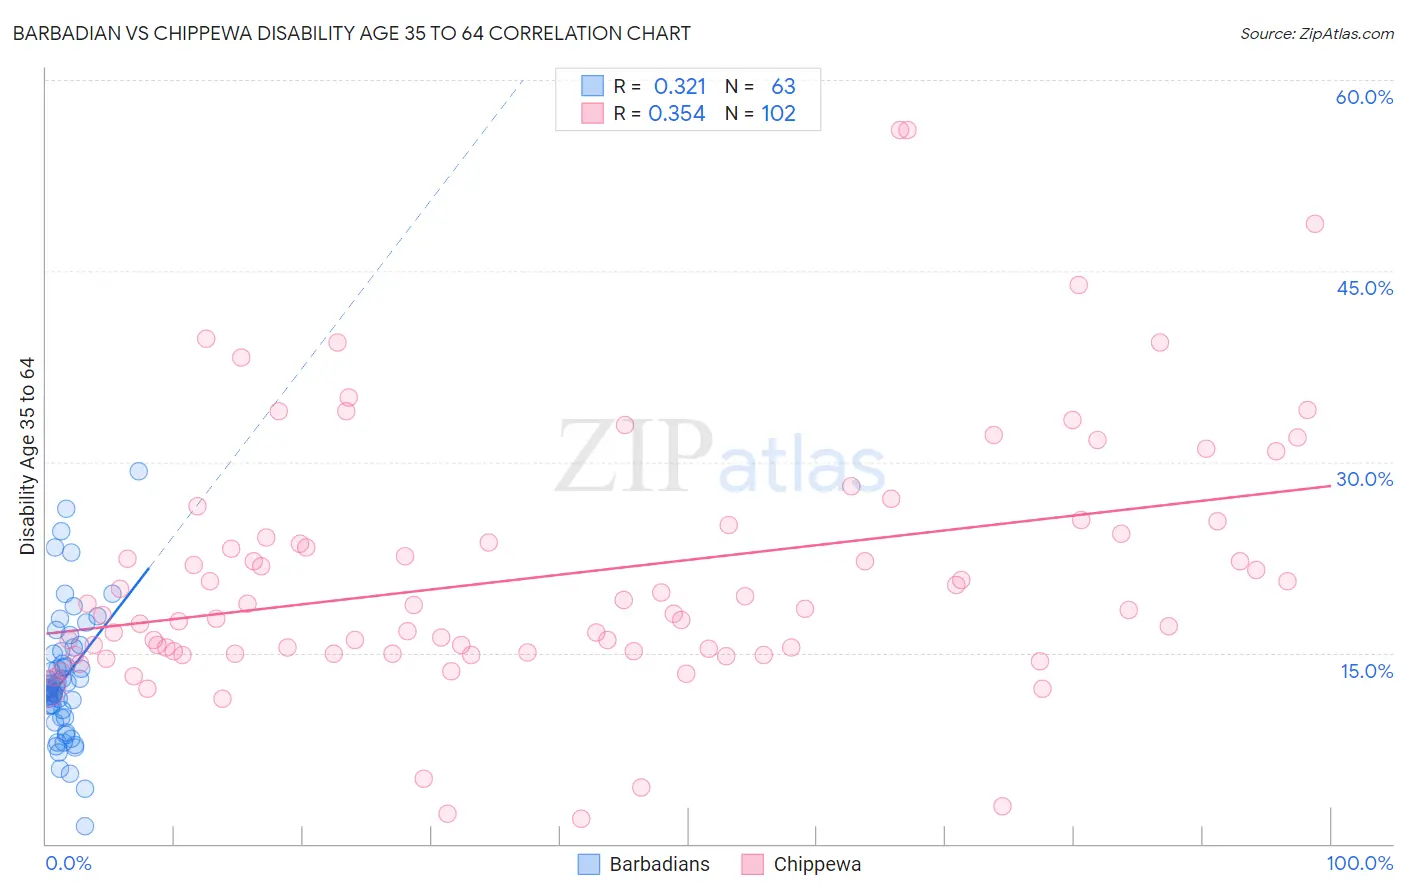
Barbadian vs Chippewa Disability Age 35 to 64 Correlation Chart
The statistical analysis conducted on geographies consisting of 141,271,675 people shows a mild positive correlation between the proportion of Barbadians and percentage of population with a disability between the ages 34 and 64 in the United States with a correlation coefficient (R) of 0.321 and weighted average of 11.8%. Similarly, the statistical analysis conducted on geographies consisting of 214,987,125 people shows a mild positive correlation between the proportion of Chippewa and percentage of population with a disability between the ages 34 and 64 in the United States with a correlation coefficient (R) of 0.354 and weighted average of 15.0%, a difference of 27.0%.
Disability Age 35 to 64 Correlation Summary
| Measurement | Barbadian | Chippewa |
| Minimum | 1.4% | 2.0% |
| Maximum | 29.3% | 56.1% |
| Range | 27.9% | 54.1% |
| Mean | 13.0% | 21.1% |
| Median | 12.2% | 18.4% |
| Interquartile 25% (IQ1) | 9.9% | 15.0% |
| Interquartile 75% (IQ3) | 15.1% | 24.3% |
| Interquartile Range (IQR) | 5.2% | 9.3% |
| Standard Deviation (Sample) | 5.1% | 10.0% |
| Standard Deviation (Population) | 5.1% | 9.9% |
Similar Demographics by Disability Age 35 to 64
Demographics Similar to Barbadians by Disability Age 35 to 64
In terms of disability age 35 to 64, the demographic groups most similar to Barbadians are Immigrants from Bahamas (11.8%, a difference of 0.050%), Czechoslovakian (11.8%, a difference of 0.10%), Immigrants from West Indies (11.8%, a difference of 0.14%), Alsatian (11.8%, a difference of 0.23%), and Honduran (11.8%, a difference of 0.25%).
| Demographics | Rating | Rank | Disability Age 35 to 64 |
| Belgians | 13.1 /100 | #210 | Poor 11.7% |
| Canadians | 13.0 /100 | #211 | Poor 11.7% |
| Immigrants | Jamaica | 11.8 /100 | #212 | Poor 11.7% |
| Yugoslavians | 11.6 /100 | #213 | Poor 11.7% |
| Immigrants | Sudan | 11.4 /100 | #214 | Poor 11.7% |
| Spanish American Indians | 11.1 /100 | #215 | Poor 11.7% |
| Bahamians | 10.7 /100 | #216 | Poor 11.8% |
| Barbadians | 9.5 /100 | #217 | Tragic 11.8% |
| Immigrants | Bahamas | 9.2 /100 | #218 | Tragic 11.8% |
| Czechoslovakians | 9.0 /100 | #219 | Tragic 11.8% |
| Immigrants | West Indies | 8.9 /100 | #220 | Tragic 11.8% |
| Alsatians | 8.5 /100 | #221 | Tragic 11.8% |
| Hondurans | 8.4 /100 | #222 | Tragic 11.8% |
| Immigrants | Honduras | 8.4 /100 | #223 | Tragic 11.8% |
| Immigrants | Ghana | 7.8 /100 | #224 | Tragic 11.8% |
Demographics Similar to Chippewa by Disability Age 35 to 64
In terms of disability age 35 to 64, the demographic groups most similar to Chippewa are Apache (14.9%, a difference of 0.20%), Arapaho (15.1%, a difference of 0.66%), Potawatomi (14.8%, a difference of 1.4%), Comanche (14.7%, a difference of 1.5%), and Black/African American (14.7%, a difference of 1.7%).
| Demographics | Rating | Rank | Disability Age 35 to 64 |
| Crow | 0.0 /100 | #317 | Tragic 14.6% |
| Ottawa | 0.0 /100 | #318 | Tragic 14.6% |
| Immigrants | Cabo Verde | 0.0 /100 | #319 | Tragic 14.7% |
| Blacks/African Americans | 0.0 /100 | #320 | Tragic 14.7% |
| Comanche | 0.0 /100 | #321 | Tragic 14.7% |
| Potawatomi | 0.0 /100 | #322 | Tragic 14.8% |
| Apache | 0.0 /100 | #323 | Tragic 14.9% |
| Chippewa | 0.0 /100 | #324 | Tragic 15.0% |
| Arapaho | 0.0 /100 | #325 | Tragic 15.1% |
| Natives/Alaskans | 0.0 /100 | #326 | Tragic 15.3% |
| Pueblo | 0.0 /100 | #327 | Tragic 15.3% |
| Cajuns | 0.0 /100 | #328 | Tragic 15.3% |
| Cherokee | 0.0 /100 | #329 | Tragic 15.5% |
| Navajo | 0.0 /100 | #330 | Tragic 15.5% |
| Dutch West Indians | 0.0 /100 | #331 | Tragic 15.6% |