Crow vs Immigrants from Southern Europe Hearing Disability
COMPARE
Crow
Immigrants from Southern Europe
Hearing Disability
Hearing Disability Comparison
Crow
Immigrants from Southern Europe
4.2%
HEARING DISABILITY
0.0/ 100
METRIC RATING
329th/ 347
METRIC RANK
3.0%
HEARING DISABILITY
35.3/ 100
METRIC RATING
185th/ 347
METRIC RANK
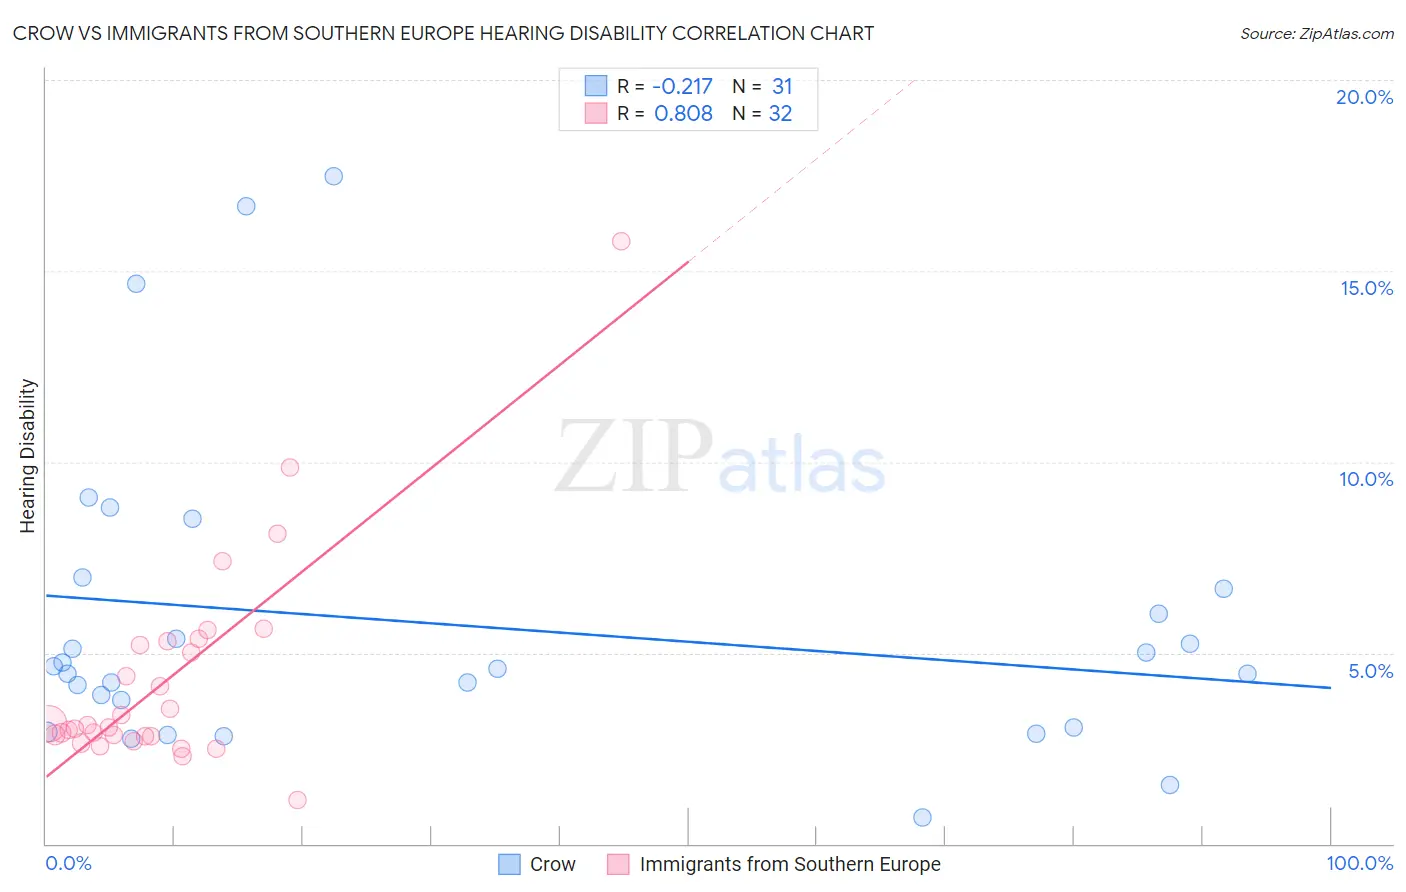
Crow vs Immigrants from Southern Europe Hearing Disability Correlation Chart
The statistical analysis conducted on geographies consisting of 59,194,968 people shows a weak negative correlation between the proportion of Crow and percentage of population with hearing disability in the United States with a correlation coefficient (R) of -0.217 and weighted average of 4.2%. Similarly, the statistical analysis conducted on geographies consisting of 402,653,873 people shows a very strong positive correlation between the proportion of Immigrants from Southern Europe and percentage of population with hearing disability in the United States with a correlation coefficient (R) of 0.808 and weighted average of 3.0%, a difference of 37.1%.
Hearing Disability Correlation Summary
| Measurement | Crow | Immigrants from Southern Europe |
| Minimum | 0.69% | 1.1% |
| Maximum | 17.5% | 15.8% |
| Range | 16.8% | 14.7% |
| Mean | 5.7% | 4.3% |
| Median | 4.6% | 3.1% |
| Interquartile 25% (IQ1) | 3.1% | 2.8% |
| Interquartile 75% (IQ3) | 6.7% | 5.3% |
| Interquartile Range (IQR) | 3.6% | 2.4% |
| Standard Deviation (Sample) | 4.0% | 2.8% |
| Standard Deviation (Population) | 3.9% | 2.8% |
Similar Demographics by Hearing Disability
Demographics Similar to Crow by Hearing Disability
In terms of hearing disability, the demographic groups most similar to Crow are Tohono O'odham (4.2%, a difference of 0.010%), Arapaho (4.1%, a difference of 0.39%), Native/Alaskan (4.2%, a difference of 0.79%), Cherokee (4.2%, a difference of 0.94%), and Potawatomi (4.1%, a difference of 1.1%).
| Demographics | Rating | Rank | Hearing Disability |
| Seminole | 0.0 /100 | #322 | Tragic 4.1% |
| Apache | 0.0 /100 | #323 | Tragic 4.1% |
| Osage | 0.0 /100 | #324 | Tragic 4.1% |
| Lumbee | 0.0 /100 | #325 | Tragic 4.1% |
| Potawatomi | 0.0 /100 | #326 | Tragic 4.1% |
| Arapaho | 0.0 /100 | #327 | Tragic 4.1% |
| Tohono O'odham | 0.0 /100 | #328 | Tragic 4.2% |
| Crow | 0.0 /100 | #329 | Tragic 4.2% |
| Natives/Alaskans | 0.0 /100 | #330 | Tragic 4.2% |
| Cherokee | 0.0 /100 | #331 | Tragic 4.2% |
| Houma | 0.0 /100 | #332 | Tragic 4.2% |
| Dutch West Indians | 0.0 /100 | #333 | Tragic 4.3% |
| Aleuts | 0.0 /100 | #334 | Tragic 4.3% |
| Kiowa | 0.0 /100 | #335 | Tragic 4.3% |
| Creek | 0.0 /100 | #336 | Tragic 4.4% |
Demographics Similar to Immigrants from Southern Europe by Hearing Disability
In terms of hearing disability, the demographic groups most similar to Immigrants from Southern Europe are Immigrants from Mexico (3.0%, a difference of 0.050%), Black/African American (3.0%, a difference of 0.060%), Mexican American Indian (3.0%, a difference of 0.070%), Immigrants from Ireland (3.0%, a difference of 0.21%), and African (3.0%, a difference of 0.25%).
| Demographics | Rating | Rank | Hearing Disability |
| Japanese | 46.0 /100 | #178 | Average 3.0% |
| Immigrants | Moldova | 43.1 /100 | #179 | Average 3.0% |
| Immigrants | Sweden | 42.4 /100 | #180 | Average 3.0% |
| Immigrants | Belgium | 41.5 /100 | #181 | Average 3.0% |
| Immigrants | Italy | 41.1 /100 | #182 | Average 3.0% |
| Bulgarians | 39.7 /100 | #183 | Fair 3.0% |
| Immigrants | Ireland | 37.4 /100 | #184 | Fair 3.0% |
| Immigrants | Southern Europe | 35.3 /100 | #185 | Fair 3.0% |
| Immigrants | Mexico | 34.9 /100 | #186 | Fair 3.0% |
| Blacks/African Americans | 34.7 /100 | #187 | Fair 3.0% |
| Mexican American Indians | 34.7 /100 | #188 | Fair 3.0% |
| Africans | 32.9 /100 | #189 | Fair 3.0% |
| Immigrants | South Africa | 31.1 /100 | #190 | Fair 3.1% |
| Immigrants | Switzerland | 28.8 /100 | #191 | Fair 3.1% |
| Koreans | 27.6 /100 | #192 | Fair 3.1% |