Crow vs Nigerian Hearing Disability
COMPARE
Crow
Nigerian
Hearing Disability
Hearing Disability Comparison
Crow
Nigerians
4.2%
HEARING DISABILITY
0.0/ 100
METRIC RATING
329th/ 347
METRIC RANK
2.6%
HEARING DISABILITY
99.4/ 100
METRIC RATING
44th/ 347
METRIC RANK
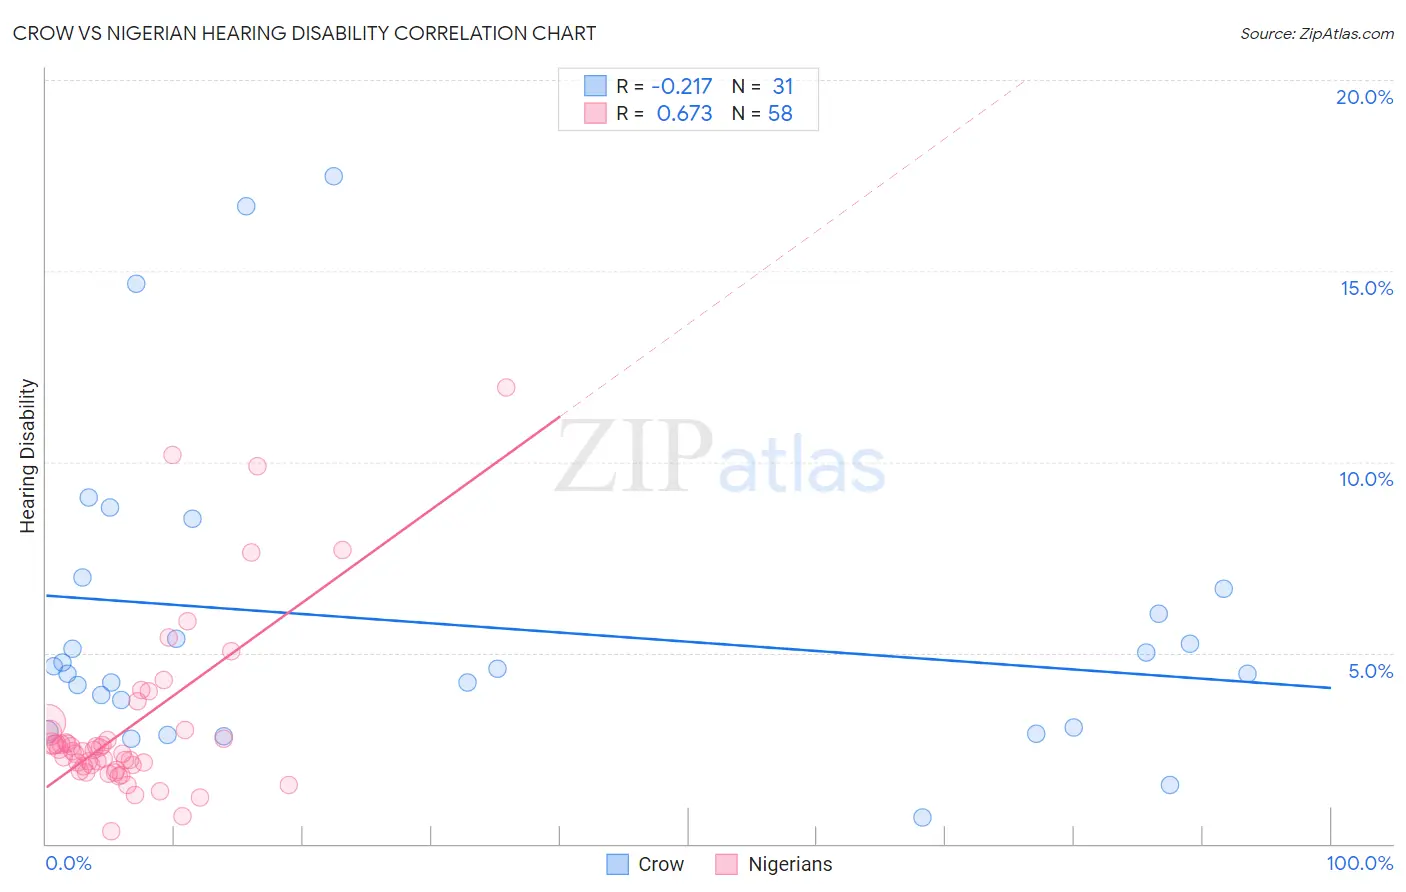
Crow vs Nigerian Hearing Disability Correlation Chart
The statistical analysis conducted on geographies consisting of 59,194,968 people shows a weak negative correlation between the proportion of Crow and percentage of population with hearing disability in the United States with a correlation coefficient (R) of -0.217 and weighted average of 4.2%. Similarly, the statistical analysis conducted on geographies consisting of 332,627,178 people shows a significant positive correlation between the proportion of Nigerians and percentage of population with hearing disability in the United States with a correlation coefficient (R) of 0.673 and weighted average of 2.6%, a difference of 57.7%.
Hearing Disability Correlation Summary
| Measurement | Crow | Nigerian |
| Minimum | 0.69% | 0.32% |
| Maximum | 17.5% | 11.9% |
| Range | 16.8% | 11.6% |
| Mean | 5.7% | 3.1% |
| Median | 4.6% | 2.4% |
| Interquartile 25% (IQ1) | 3.1% | 2.0% |
| Interquartile 75% (IQ3) | 6.7% | 2.9% |
| Interquartile Range (IQR) | 3.6% | 0.89% |
| Standard Deviation (Sample) | 4.0% | 2.3% |
| Standard Deviation (Population) | 3.9% | 2.2% |
Similar Demographics by Hearing Disability
Demographics Similar to Crow by Hearing Disability
In terms of hearing disability, the demographic groups most similar to Crow are Tohono O'odham (4.2%, a difference of 0.010%), Arapaho (4.1%, a difference of 0.39%), Native/Alaskan (4.2%, a difference of 0.79%), Cherokee (4.2%, a difference of 0.94%), and Potawatomi (4.1%, a difference of 1.1%).
| Demographics | Rating | Rank | Hearing Disability |
| Seminole | 0.0 /100 | #322 | Tragic 4.1% |
| Apache | 0.0 /100 | #323 | Tragic 4.1% |
| Osage | 0.0 /100 | #324 | Tragic 4.1% |
| Lumbee | 0.0 /100 | #325 | Tragic 4.1% |
| Potawatomi | 0.0 /100 | #326 | Tragic 4.1% |
| Arapaho | 0.0 /100 | #327 | Tragic 4.1% |
| Tohono O'odham | 0.0 /100 | #328 | Tragic 4.2% |
| Crow | 0.0 /100 | #329 | Tragic 4.2% |
| Natives/Alaskans | 0.0 /100 | #330 | Tragic 4.2% |
| Cherokee | 0.0 /100 | #331 | Tragic 4.2% |
| Houma | 0.0 /100 | #332 | Tragic 4.2% |
| Dutch West Indians | 0.0 /100 | #333 | Tragic 4.3% |
| Aleuts | 0.0 /100 | #334 | Tragic 4.3% |
| Kiowa | 0.0 /100 | #335 | Tragic 4.3% |
| Creek | 0.0 /100 | #336 | Tragic 4.4% |
Demographics Similar to Nigerians by Hearing Disability
In terms of hearing disability, the demographic groups most similar to Nigerians are Venezuelan (2.6%, a difference of 0.020%), Immigrants from Dominica (2.6%, a difference of 0.13%), Senegalese (2.6%, a difference of 0.22%), Immigrants from Taiwan (2.6%, a difference of 0.23%), and West Indian (2.6%, a difference of 0.23%).
| Demographics | Rating | Rank | Hearing Disability |
| Immigrants | Western Africa | 99.6 /100 | #37 | Exceptional 2.6% |
| Immigrants | Jamaica | 99.5 /100 | #38 | Exceptional 2.6% |
| Immigrants | China | 99.5 /100 | #39 | Exceptional 2.6% |
| Haitians | 99.5 /100 | #40 | Exceptional 2.6% |
| Immigrants | Taiwan | 99.4 /100 | #41 | Exceptional 2.6% |
| West Indians | 99.4 /100 | #42 | Exceptional 2.6% |
| Senegalese | 99.4 /100 | #43 | Exceptional 2.6% |
| Nigerians | 99.4 /100 | #44 | Exceptional 2.6% |
| Venezuelans | 99.4 /100 | #45 | Exceptional 2.6% |
| Immigrants | Dominica | 99.3 /100 | #46 | Exceptional 2.6% |
| Immigrants | Israel | 99.3 /100 | #47 | Exceptional 2.6% |
| Immigrants | Singapore | 99.3 /100 | #48 | Exceptional 2.6% |
| Immigrants | South America | 99.2 /100 | #49 | Exceptional 2.7% |
| Paraguayans | 99.2 /100 | #50 | Exceptional 2.7% |
| Immigrants | Hong Kong | 99.2 /100 | #51 | Exceptional 2.7% |