Immigrants from Albania vs Bulgarian Disability
COMPARE
Immigrants from Albania
Bulgarian
Disability
Disability Comparison
Immigrants from Albania
Bulgarians
11.7%
DISABILITY
52.8/ 100
METRIC RATING
170th/ 347
METRIC RANK
11.0%
DISABILITY
99.6/ 100
METRIC RATING
65th/ 347
METRIC RANK
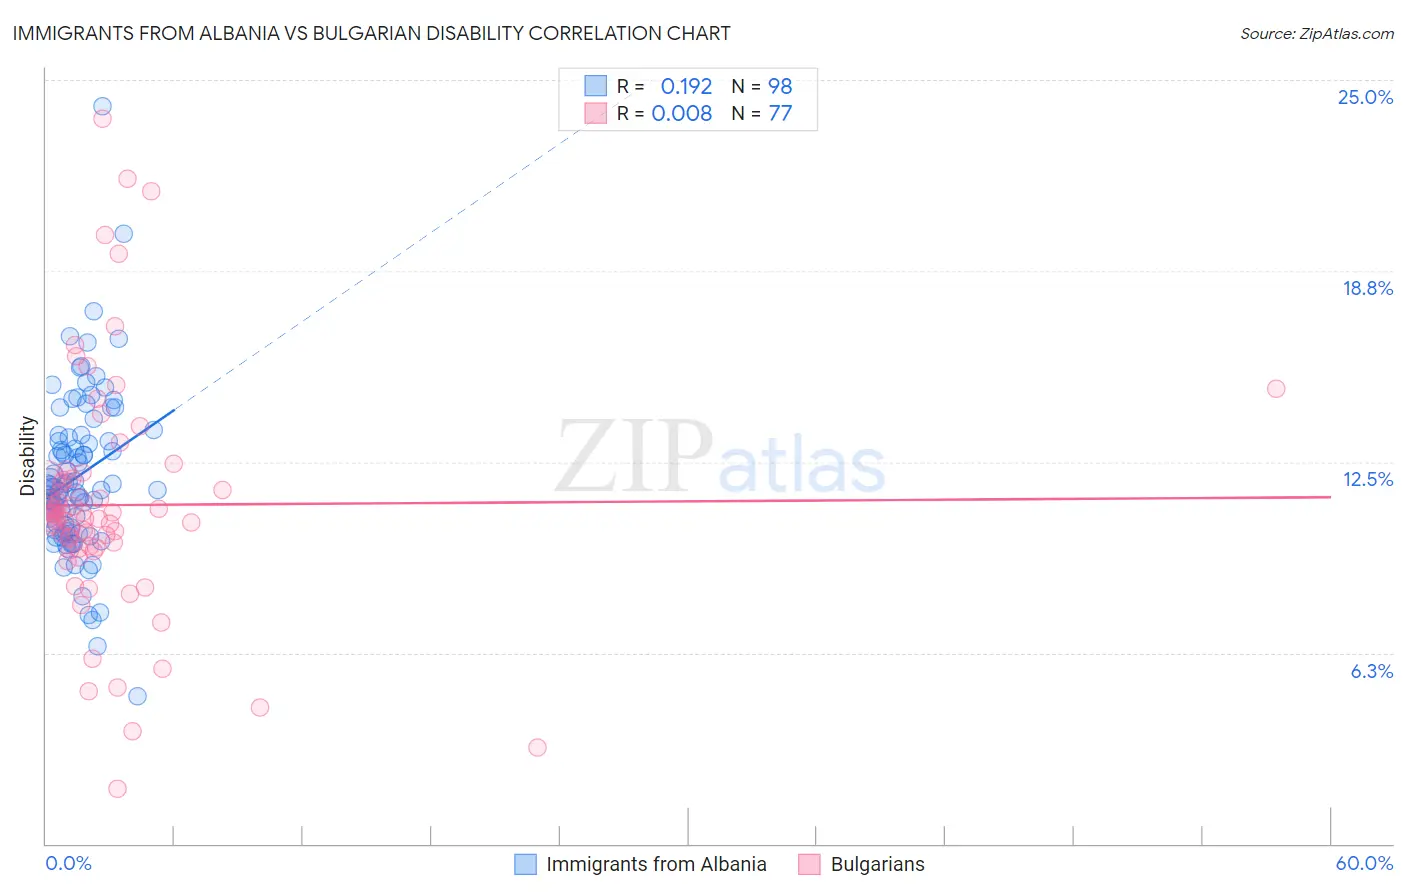
Immigrants from Albania vs Bulgarian Disability Correlation Chart
The statistical analysis conducted on geographies consisting of 119,399,287 people shows a poor positive correlation between the proportion of Immigrants from Albania and percentage of population with a disability in the United States with a correlation coefficient (R) of 0.192 and weighted average of 11.7%. Similarly, the statistical analysis conducted on geographies consisting of 205,630,627 people shows no correlation between the proportion of Bulgarians and percentage of population with a disability in the United States with a correlation coefficient (R) of 0.008 and weighted average of 11.0%, a difference of 6.5%.
Disability Correlation Summary
| Measurement | Immigrants from Albania | Bulgarian |
| Minimum | 4.8% | 1.8% |
| Maximum | 24.1% | 23.7% |
| Range | 19.3% | 21.9% |
| Mean | 12.0% | 11.1% |
| Median | 11.6% | 10.7% |
| Interquartile 25% (IQ1) | 10.3% | 9.7% |
| Interquartile 75% (IQ3) | 13.3% | 11.9% |
| Interquartile Range (IQR) | 3.0% | 2.3% |
| Standard Deviation (Sample) | 2.7% | 3.9% |
| Standard Deviation (Population) | 2.7% | 3.9% |
Similar Demographics by Disability
Demographics Similar to Immigrants from Albania by Disability
In terms of disability, the demographic groups most similar to Immigrants from Albania are Immigrants from Southern Europe (11.7%, a difference of 0.0%), Trinidadian and Tobagonian (11.7%, a difference of 0.010%), Immigrants from Austria (11.7%, a difference of 0.030%), Immigrants from Latin America (11.7%, a difference of 0.060%), and Estonian (11.7%, a difference of 0.070%).
| Demographics | Rating | Rank | Disability |
| Immigrants | Trinidad and Tobago | 58.9 /100 | #163 | Average 11.7% |
| Syrians | 58.5 /100 | #164 | Average 11.7% |
| Cubans | 56.7 /100 | #165 | Average 11.7% |
| Pakistanis | 54.7 /100 | #166 | Average 11.7% |
| Estonians | 54.4 /100 | #167 | Average 11.7% |
| Immigrants | Latin America | 54.1 /100 | #168 | Average 11.7% |
| Immigrants | Austria | 53.4 /100 | #169 | Average 11.7% |
| Immigrants | Albania | 52.8 /100 | #170 | Average 11.7% |
| Immigrants | Southern Europe | 52.8 /100 | #171 | Average 11.7% |
| Trinidadians and Tobagonians | 52.7 /100 | #172 | Average 11.7% |
| Maltese | 50.6 /100 | #173 | Average 11.7% |
| Albanians | 50.0 /100 | #174 | Average 11.7% |
| Haitians | 48.6 /100 | #175 | Average 11.7% |
| Immigrants | Western Africa | 47.5 /100 | #176 | Average 11.7% |
| Immigrants | Central America | 46.6 /100 | #177 | Average 11.7% |
Demographics Similar to Bulgarians by Disability
In terms of disability, the demographic groups most similar to Bulgarians are Laotian (11.0%, a difference of 0.010%), Immigrants from Sweden (11.0%, a difference of 0.020%), Colombian (11.0%, a difference of 0.10%), Immigrants from Eritrea (11.0%, a difference of 0.20%), and Immigrants from Northern Africa (10.9%, a difference of 0.22%).
| Demographics | Rating | Rank | Disability |
| Immigrants | South America | 99.8 /100 | #58 | Exceptional 10.9% |
| Immigrants | Colombia | 99.7 /100 | #59 | Exceptional 10.9% |
| Zimbabweans | 99.7 /100 | #60 | Exceptional 10.9% |
| Immigrants | Bulgaria | 99.7 /100 | #61 | Exceptional 10.9% |
| Immigrants | Northern Africa | 99.7 /100 | #62 | Exceptional 10.9% |
| Immigrants | Eritrea | 99.7 /100 | #63 | Exceptional 11.0% |
| Immigrants | Sweden | 99.6 /100 | #64 | Exceptional 11.0% |
| Bulgarians | 99.6 /100 | #65 | Exceptional 11.0% |
| Laotians | 99.6 /100 | #66 | Exceptional 11.0% |
| Colombians | 99.6 /100 | #67 | Exceptional 11.0% |
| Immigrants | Afghanistan | 99.6 /100 | #68 | Exceptional 11.0% |
| Sri Lankans | 99.5 /100 | #69 | Exceptional 11.0% |
| Immigrants | France | 99.4 /100 | #70 | Exceptional 11.0% |
| Immigrants | Lebanon | 99.4 /100 | #71 | Exceptional 11.0% |
| Immigrants | Chile | 99.4 /100 | #72 | Exceptional 11.0% |