Immigrants from Sri Lanka vs Bulgarian Disability
COMPARE
Immigrants from Sri Lanka
Bulgarian
Disability
Disability Comparison
Immigrants from Sri Lanka
Bulgarians
10.5%
DISABILITY
100.0/ 100
METRIC RATING
22nd/ 347
METRIC RANK
11.0%
DISABILITY
99.6/ 100
METRIC RATING
65th/ 347
METRIC RANK
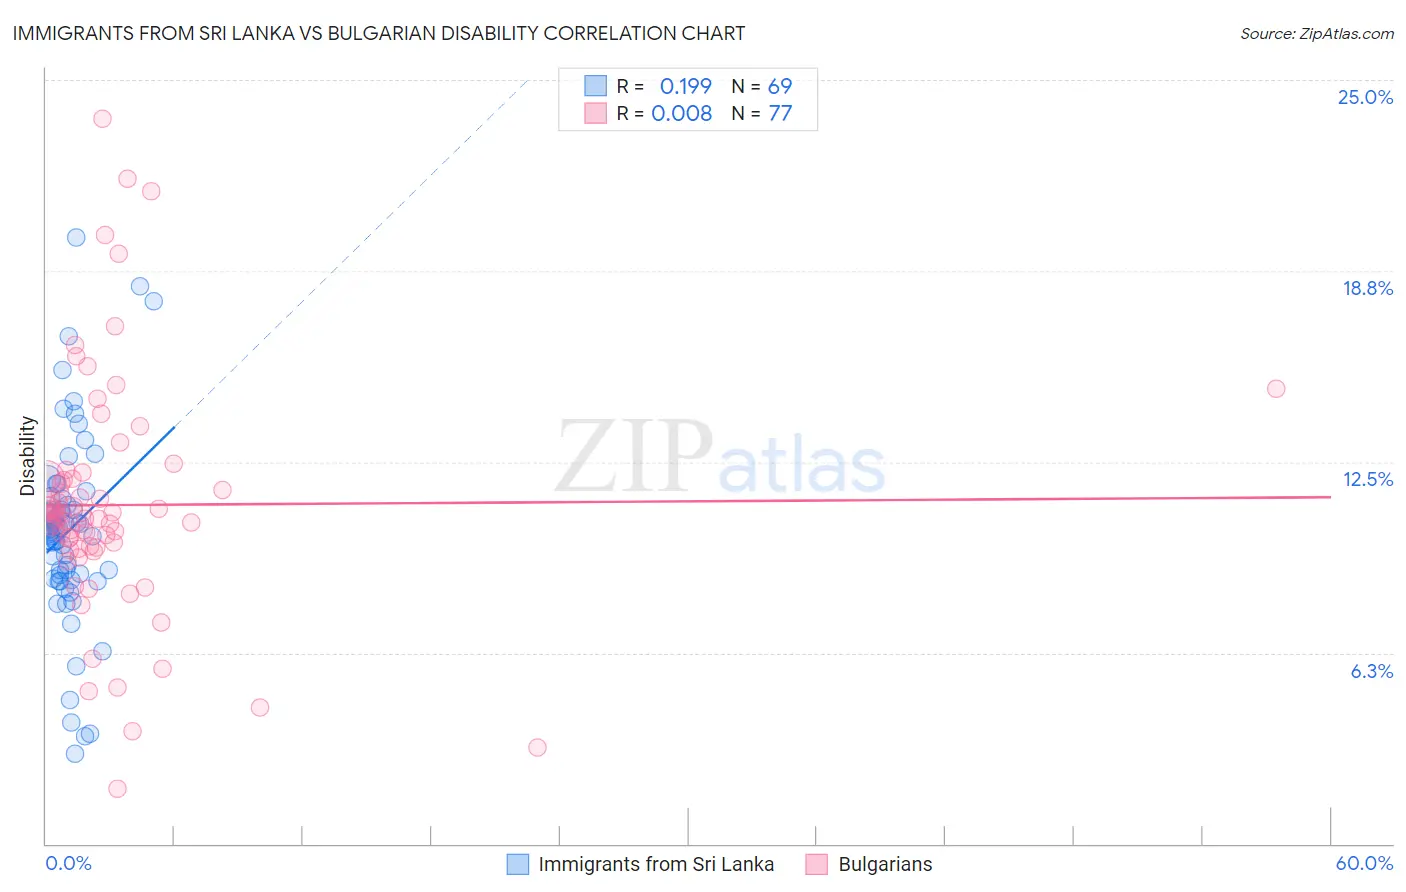
Immigrants from Sri Lanka vs Bulgarian Disability Correlation Chart
The statistical analysis conducted on geographies consisting of 149,700,552 people shows a poor positive correlation between the proportion of Immigrants from Sri Lanka and percentage of population with a disability in the United States with a correlation coefficient (R) of 0.199 and weighted average of 10.5%. Similarly, the statistical analysis conducted on geographies consisting of 205,630,627 people shows no correlation between the proportion of Bulgarians and percentage of population with a disability in the United States with a correlation coefficient (R) of 0.008 and weighted average of 11.0%, a difference of 5.0%.
Disability Correlation Summary
| Measurement | Immigrants from Sri Lanka | Bulgarian |
| Minimum | 2.9% | 1.8% |
| Maximum | 19.8% | 23.7% |
| Range | 16.9% | 21.9% |
| Mean | 10.2% | 11.1% |
| Median | 10.2% | 10.7% |
| Interquartile 25% (IQ1) | 8.7% | 9.7% |
| Interquartile 75% (IQ3) | 11.3% | 11.9% |
| Interquartile Range (IQR) | 2.7% | 2.3% |
| Standard Deviation (Sample) | 3.2% | 3.9% |
| Standard Deviation (Population) | 3.2% | 3.9% |
Similar Demographics by Disability
Demographics Similar to Immigrants from Sri Lanka by Disability
In terms of disability, the demographic groups most similar to Immigrants from Sri Lanka are Asian (10.4%, a difference of 0.10%), Immigrants from Venezuela (10.4%, a difference of 0.13%), Immigrants from Asia (10.5%, a difference of 0.69%), Immigrants from Pakistan (10.4%, a difference of 0.82%), and Burmese (10.4%, a difference of 0.83%).
| Demographics | Rating | Rank | Disability |
| Okinawans | 100.0 /100 | #15 | Exceptional 10.3% |
| Indians (Asian) | 100.0 /100 | #16 | Exceptional 10.3% |
| Immigrants | Iran | 100.0 /100 | #17 | Exceptional 10.3% |
| Burmese | 100.0 /100 | #18 | Exceptional 10.4% |
| Immigrants | Pakistan | 100.0 /100 | #19 | Exceptional 10.4% |
| Immigrants | Venezuela | 100.0 /100 | #20 | Exceptional 10.4% |
| Asians | 100.0 /100 | #21 | Exceptional 10.4% |
| Immigrants | Sri Lanka | 100.0 /100 | #22 | Exceptional 10.5% |
| Immigrants | Asia | 100.0 /100 | #23 | Exceptional 10.5% |
| Venezuelans | 100.0 /100 | #24 | Exceptional 10.5% |
| Immigrants | Malaysia | 100.0 /100 | #25 | Exceptional 10.6% |
| Argentineans | 100.0 /100 | #26 | Exceptional 10.6% |
| Cypriots | 100.0 /100 | #27 | Exceptional 10.6% |
| Egyptians | 100.0 /100 | #28 | Exceptional 10.6% |
| Immigrants | Argentina | 100.0 /100 | #29 | Exceptional 10.6% |
Demographics Similar to Bulgarians by Disability
In terms of disability, the demographic groups most similar to Bulgarians are Laotian (11.0%, a difference of 0.010%), Immigrants from Sweden (11.0%, a difference of 0.020%), Colombian (11.0%, a difference of 0.10%), Immigrants from Eritrea (11.0%, a difference of 0.20%), and Immigrants from Northern Africa (10.9%, a difference of 0.22%).
| Demographics | Rating | Rank | Disability |
| Immigrants | South America | 99.8 /100 | #58 | Exceptional 10.9% |
| Immigrants | Colombia | 99.7 /100 | #59 | Exceptional 10.9% |
| Zimbabweans | 99.7 /100 | #60 | Exceptional 10.9% |
| Immigrants | Bulgaria | 99.7 /100 | #61 | Exceptional 10.9% |
| Immigrants | Northern Africa | 99.7 /100 | #62 | Exceptional 10.9% |
| Immigrants | Eritrea | 99.7 /100 | #63 | Exceptional 11.0% |
| Immigrants | Sweden | 99.6 /100 | #64 | Exceptional 11.0% |
| Bulgarians | 99.6 /100 | #65 | Exceptional 11.0% |
| Laotians | 99.6 /100 | #66 | Exceptional 11.0% |
| Colombians | 99.6 /100 | #67 | Exceptional 11.0% |
| Immigrants | Afghanistan | 99.6 /100 | #68 | Exceptional 11.0% |
| Sri Lankans | 99.5 /100 | #69 | Exceptional 11.0% |
| Immigrants | France | 99.4 /100 | #70 | Exceptional 11.0% |
| Immigrants | Lebanon | 99.4 /100 | #71 | Exceptional 11.0% |
| Immigrants | Chile | 99.4 /100 | #72 | Exceptional 11.0% |