Immigrants from Central America vs Sudanese Ambulatory Disability
COMPARE
Immigrants from Central America
Sudanese
Ambulatory Disability
Ambulatory Disability Comparison
Immigrants from Central America
Sudanese
6.2%
AMBULATORY DISABILITY
20.1/ 100
METRIC RATING
201st/ 347
METRIC RANK
5.7%
AMBULATORY DISABILITY
99.3/ 100
METRIC RATING
76th/ 347
METRIC RANK
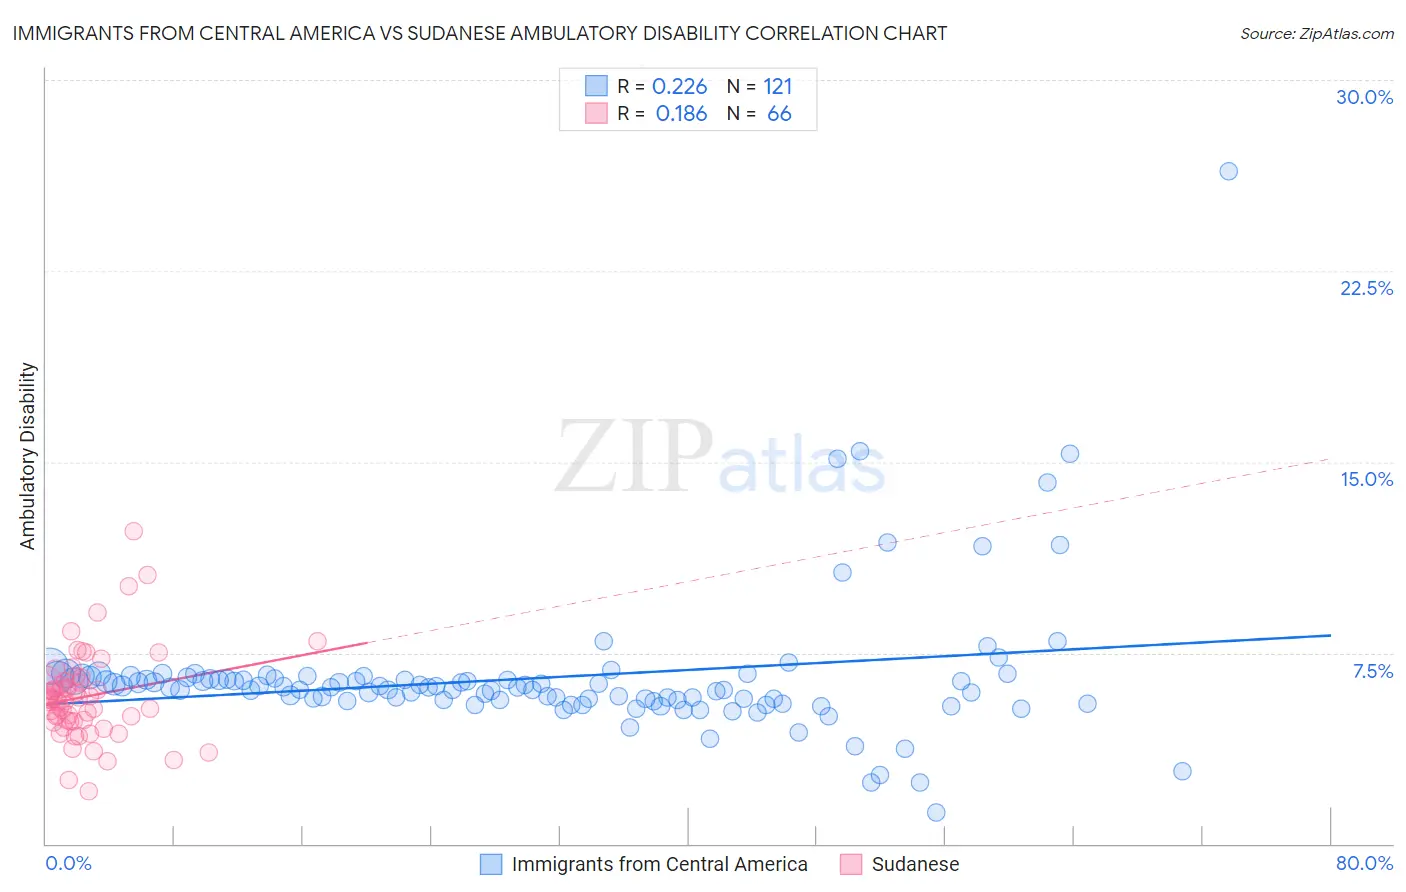
Immigrants from Central America vs Sudanese Ambulatory Disability Correlation Chart
The statistical analysis conducted on geographies consisting of 536,120,353 people shows a weak positive correlation between the proportion of Immigrants from Central America and percentage of population with ambulatory disability in the United States with a correlation coefficient (R) of 0.226 and weighted average of 6.2%. Similarly, the statistical analysis conducted on geographies consisting of 110,129,493 people shows a poor positive correlation between the proportion of Sudanese and percentage of population with ambulatory disability in the United States with a correlation coefficient (R) of 0.186 and weighted average of 5.7%, a difference of 9.1%.
Ambulatory Disability Correlation Summary
| Measurement | Immigrants from Central America | Sudanese |
| Minimum | 1.2% | 2.1% |
| Maximum | 26.4% | 12.3% |
| Range | 25.2% | 10.2% |
| Mean | 6.5% | 5.8% |
| Median | 6.2% | 5.6% |
| Interquartile 25% (IQ1) | 5.7% | 4.8% |
| Interquartile 75% (IQ3) | 6.5% | 6.3% |
| Interquartile Range (IQR) | 0.85% | 1.5% |
| Standard Deviation (Sample) | 2.8% | 1.8% |
| Standard Deviation (Population) | 2.8% | 1.7% |
Similar Demographics by Ambulatory Disability
Demographics Similar to Immigrants from Central America by Ambulatory Disability
In terms of ambulatory disability, the demographic groups most similar to Immigrants from Central America are Albanian (6.2%, a difference of 0.030%), Immigrants from Cambodia (6.2%, a difference of 0.11%), Immigrants from Ukraine (6.2%, a difference of 0.14%), Immigrants from Congo (6.2%, a difference of 0.15%), and Slovene (6.2%, a difference of 0.17%).
| Demographics | Rating | Rank | Ambulatory Disability |
| Alaska Natives | 29.8 /100 | #194 | Fair 6.2% |
| Belgians | 28.6 /100 | #195 | Fair 6.2% |
| Malaysians | 28.2 /100 | #196 | Fair 6.2% |
| Poles | 26.3 /100 | #197 | Fair 6.2% |
| Immigrants | Bangladesh | 24.6 /100 | #198 | Fair 6.2% |
| Italians | 22.6 /100 | #199 | Fair 6.2% |
| Immigrants | Cambodia | 21.5 /100 | #200 | Fair 6.2% |
| Immigrants | Central America | 20.1 /100 | #201 | Fair 6.2% |
| Albanians | 19.7 /100 | #202 | Poor 6.2% |
| Immigrants | Ukraine | 18.4 /100 | #203 | Poor 6.2% |
| Immigrants | Congo | 18.2 /100 | #204 | Poor 6.2% |
| Slovenes | 18.0 /100 | #205 | Poor 6.2% |
| Finns | 17.2 /100 | #206 | Poor 6.2% |
| Alsatians | 15.1 /100 | #207 | Poor 6.3% |
| Bangladeshis | 14.2 /100 | #208 | Poor 6.3% |
Demographics Similar to Sudanese by Ambulatory Disability
In terms of ambulatory disability, the demographic groups most similar to Sudanese are Immigrants from South Africa (5.7%, a difference of 0.020%), Immigrants from Cameroon (5.7%, a difference of 0.070%), Immigrants from Northern Africa (5.7%, a difference of 0.080%), Brazilian (5.7%, a difference of 0.090%), and Immigrants from Peru (5.7%, a difference of 0.12%).
| Demographics | Rating | Rank | Ambulatory Disability |
| Peruvians | 99.5 /100 | #69 | Exceptional 5.7% |
| Sierra Leoneans | 99.4 /100 | #70 | Exceptional 5.7% |
| Immigrants | Peru | 99.4 /100 | #71 | Exceptional 5.7% |
| Brazilians | 99.4 /100 | #72 | Exceptional 5.7% |
| Immigrants | Northern Africa | 99.4 /100 | #73 | Exceptional 5.7% |
| Immigrants | Cameroon | 99.4 /100 | #74 | Exceptional 5.7% |
| Immigrants | South Africa | 99.3 /100 | #75 | Exceptional 5.7% |
| Sudanese | 99.3 /100 | #76 | Exceptional 5.7% |
| Immigrants | Vietnam | 99.3 /100 | #77 | Exceptional 5.7% |
| Somalis | 99.2 /100 | #78 | Exceptional 5.7% |
| Chileans | 99.2 /100 | #79 | Exceptional 5.7% |
| Immigrants | Ireland | 99.2 /100 | #80 | Exceptional 5.7% |
| Immigrants | Jordan | 99.2 /100 | #81 | Exceptional 5.7% |
| Palestinians | 99.2 /100 | #82 | Exceptional 5.7% |
| Eastern Europeans | 99.2 /100 | #83 | Exceptional 5.7% |