Immigrants from El Salvador vs Sudanese Ambulatory Disability
COMPARE
Immigrants from El Salvador
Sudanese
Ambulatory Disability
Ambulatory Disability Comparison
Immigrants from El Salvador
Sudanese
5.8%
AMBULATORY DISABILITY
98.4/ 100
METRIC RATING
95th/ 347
METRIC RANK
5.7%
AMBULATORY DISABILITY
99.3/ 100
METRIC RATING
76th/ 347
METRIC RANK
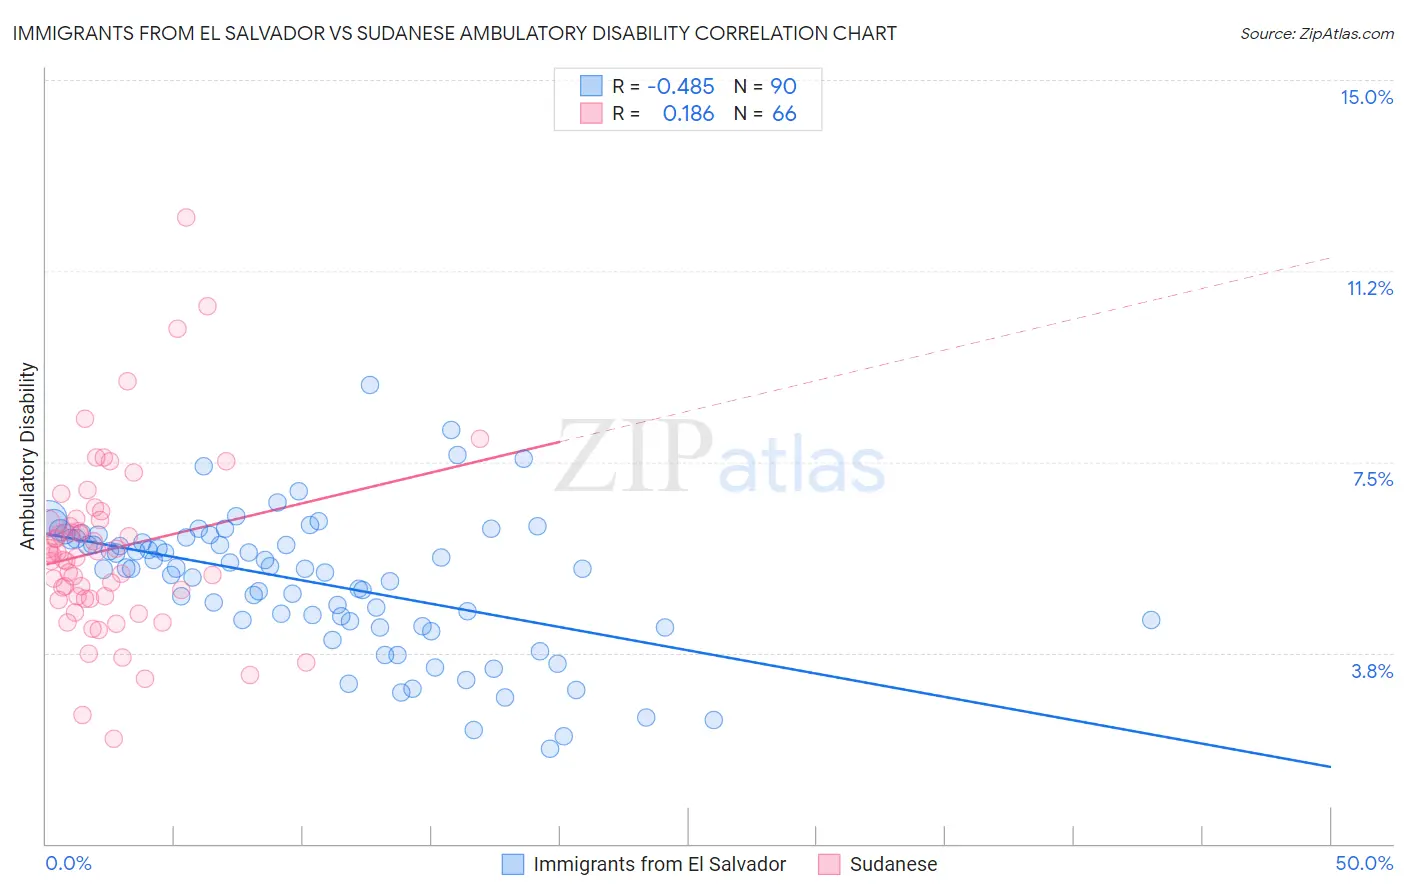
Immigrants from El Salvador vs Sudanese Ambulatory Disability Correlation Chart
The statistical analysis conducted on geographies consisting of 357,732,482 people shows a moderate negative correlation between the proportion of Immigrants from El Salvador and percentage of population with ambulatory disability in the United States with a correlation coefficient (R) of -0.485 and weighted average of 5.8%. Similarly, the statistical analysis conducted on geographies consisting of 110,129,493 people shows a poor positive correlation between the proportion of Sudanese and percentage of population with ambulatory disability in the United States with a correlation coefficient (R) of 0.186 and weighted average of 5.7%, a difference of 1.3%.
Ambulatory Disability Correlation Summary
| Measurement | Immigrants from El Salvador | Sudanese |
| Minimum | 1.9% | 2.1% |
| Maximum | 9.0% | 12.3% |
| Range | 7.1% | 10.2% |
| Mean | 5.1% | 5.8% |
| Median | 5.4% | 5.6% |
| Interquartile 25% (IQ1) | 4.4% | 4.8% |
| Interquartile 75% (IQ3) | 6.0% | 6.3% |
| Interquartile Range (IQR) | 1.6% | 1.5% |
| Standard Deviation (Sample) | 1.4% | 1.8% |
| Standard Deviation (Population) | 1.4% | 1.7% |
Demographics Similar to Immigrants from El Salvador and Sudanese by Ambulatory Disability
In terms of ambulatory disability, the demographic groups most similar to Immigrants from El Salvador are Kenyan (5.8%, a difference of 0.040%), Immigrants from Denmark (5.8%, a difference of 0.23%), Immigrants from Sierra Leone (5.8%, a difference of 0.24%), Immigrants from Sudan (5.8%, a difference of 0.40%), and Bhutanese (5.8%, a difference of 0.41%). Similarly, the demographic groups most similar to Sudanese are Immigrants from South Africa (5.7%, a difference of 0.020%), Immigrants from Vietnam (5.7%, a difference of 0.17%), Somali (5.7%, a difference of 0.19%), Chilean (5.7%, a difference of 0.19%), and Immigrants from Ireland (5.7%, a difference of 0.32%).
| Demographics | Rating | Rank | Ambulatory Disability |
| Immigrants | South Africa | 99.3 /100 | #75 | Exceptional 5.7% |
| Sudanese | 99.3 /100 | #76 | Exceptional 5.7% |
| Immigrants | Vietnam | 99.3 /100 | #77 | Exceptional 5.7% |
| Somalis | 99.2 /100 | #78 | Exceptional 5.7% |
| Chileans | 99.2 /100 | #79 | Exceptional 5.7% |
| Immigrants | Ireland | 99.2 /100 | #80 | Exceptional 5.7% |
| Immigrants | Jordan | 99.2 /100 | #81 | Exceptional 5.7% |
| Palestinians | 99.2 /100 | #82 | Exceptional 5.7% |
| Eastern Europeans | 99.2 /100 | #83 | Exceptional 5.7% |
| Ugandans | 99.2 /100 | #84 | Exceptional 5.7% |
| South Americans | 99.0 /100 | #85 | Exceptional 5.7% |
| Latvians | 99.0 /100 | #86 | Exceptional 5.7% |
| Immigrants | Chile | 98.9 /100 | #87 | Exceptional 5.8% |
| Soviet Union | 98.9 /100 | #88 | Exceptional 5.8% |
| Bhutanese | 98.8 /100 | #89 | Exceptional 5.8% |
| Australians | 98.8 /100 | #90 | Exceptional 5.8% |
| Immigrants | Sudan | 98.8 /100 | #91 | Exceptional 5.8% |
| Immigrants | Sierra Leone | 98.6 /100 | #92 | Exceptional 5.8% |
| Immigrants | Denmark | 98.6 /100 | #93 | Exceptional 5.8% |
| Kenyans | 98.4 /100 | #94 | Exceptional 5.8% |
| Immigrants | El Salvador | 98.4 /100 | #95 | Exceptional 5.8% |