European vs Korean Ambulatory Disability
COMPARE
European
Korean
Ambulatory Disability
Ambulatory Disability Comparison
Europeans
Koreans
6.2%
AMBULATORY DISABILITY
36.2/ 100
METRIC RATING
186th/ 347
METRIC RANK
5.9%
AMBULATORY DISABILITY
91.6/ 100
METRIC RATING
125th/ 347
METRIC RANK
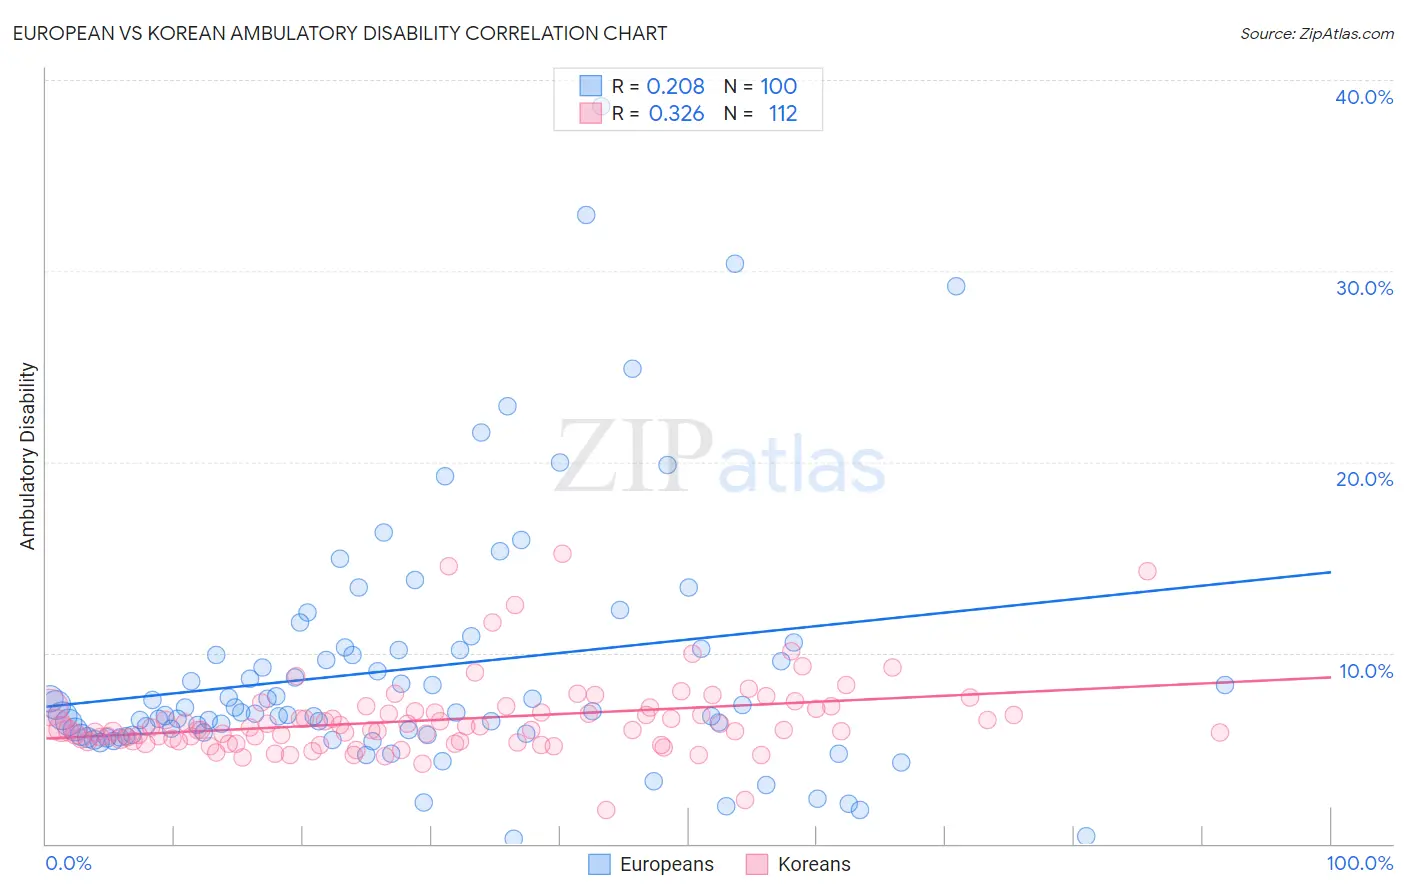
European vs Korean Ambulatory Disability Correlation Chart
The statistical analysis conducted on geographies consisting of 561,341,631 people shows a weak positive correlation between the proportion of Europeans and percentage of population with ambulatory disability in the United States with a correlation coefficient (R) of 0.208 and weighted average of 6.2%. Similarly, the statistical analysis conducted on geographies consisting of 510,581,293 people shows a mild positive correlation between the proportion of Koreans and percentage of population with ambulatory disability in the United States with a correlation coefficient (R) of 0.326 and weighted average of 5.9%, a difference of 4.0%.
Ambulatory Disability Correlation Summary
| Measurement | European | Korean |
| Minimum | 0.26% | 1.8% |
| Maximum | 38.6% | 15.2% |
| Range | 38.4% | 13.4% |
| Mean | 9.2% | 6.5% |
| Median | 6.9% | 6.0% |
| Interquartile 25% (IQ1) | 5.7% | 5.4% |
| Interquartile 75% (IQ3) | 10.2% | 7.0% |
| Interquartile Range (IQR) | 4.5% | 1.6% |
| Standard Deviation (Sample) | 6.7% | 2.0% |
| Standard Deviation (Population) | 6.7% | 2.0% |
Similar Demographics by Ambulatory Disability
Demographics Similar to Europeans by Ambulatory Disability
In terms of ambulatory disability, the demographic groups most similar to Europeans are Carpatho Rusyn (6.2%, a difference of 0.050%), Immigrants from Bosnia and Herzegovina (6.2%, a difference of 0.060%), British (6.2%, a difference of 0.11%), Ukrainian (6.2%, a difference of 0.13%), and Immigrants from Western Africa (6.2%, a difference of 0.17%).
| Demographics | Rating | Rank | Ambulatory Disability |
| Austrians | 44.1 /100 | #179 | Average 6.1% |
| Immigrants | Nicaragua | 43.9 /100 | #180 | Average 6.1% |
| Swiss | 43.1 /100 | #181 | Average 6.1% |
| Serbians | 42.8 /100 | #182 | Average 6.1% |
| Immigrants | Thailand | 42.2 /100 | #183 | Average 6.1% |
| Immigrants | Ghana | 41.2 /100 | #184 | Average 6.1% |
| Immigrants | Bosnia and Herzegovina | 37.2 /100 | #185 | Fair 6.2% |
| Europeans | 36.2 /100 | #186 | Fair 6.2% |
| Carpatho Rusyns | 35.3 /100 | #187 | Fair 6.2% |
| British | 34.3 /100 | #188 | Fair 6.2% |
| Ukrainians | 34.0 /100 | #189 | Fair 6.2% |
| Immigrants | Western Africa | 33.4 /100 | #190 | Fair 6.2% |
| Immigrants | Guatemala | 31.9 /100 | #191 | Fair 6.2% |
| Immigrants | Western Europe | 31.6 /100 | #192 | Fair 6.2% |
| Guatemalans | 30.0 /100 | #193 | Fair 6.2% |
Demographics Similar to Koreans by Ambulatory Disability
In terms of ambulatory disability, the demographic groups most similar to Koreans are Arab (5.9%, a difference of 0.020%), Immigrants from Nigeria (5.9%, a difference of 0.11%), Immigrants from Middle Africa (5.9%, a difference of 0.12%), Immigrants from Western Asia (5.9%, a difference of 0.15%), and Immigrants from Russia (5.9%, a difference of 0.16%).
| Demographics | Rating | Rank | Ambulatory Disability |
| Russians | 93.4 /100 | #118 | Exceptional 5.9% |
| Norwegians | 93.1 /100 | #119 | Exceptional 5.9% |
| Estonians | 92.9 /100 | #120 | Exceptional 5.9% |
| Costa Ricans | 92.6 /100 | #121 | Exceptional 5.9% |
| Icelanders | 92.6 /100 | #122 | Exceptional 5.9% |
| Immigrants | Russia | 92.4 /100 | #123 | Exceptional 5.9% |
| Immigrants | Middle Africa | 92.2 /100 | #124 | Exceptional 5.9% |
| Koreans | 91.6 /100 | #125 | Exceptional 5.9% |
| Arabs | 91.5 /100 | #126 | Exceptional 5.9% |
| Immigrants | Nigeria | 90.9 /100 | #127 | Exceptional 5.9% |
| Immigrants | Western Asia | 90.7 /100 | #128 | Exceptional 5.9% |
| Immigrants | Norway | 90.5 /100 | #129 | Exceptional 5.9% |
| Immigrants | Kazakhstan | 89.7 /100 | #130 | Excellent 5.9% |
| Immigrants | Costa Rica | 89.5 /100 | #131 | Excellent 5.9% |
| Immigrants | Europe | 87.8 /100 | #132 | Excellent 6.0% |