Cambodian vs Korean Ambulatory Disability
COMPARE
Cambodian
Korean
Ambulatory Disability
Ambulatory Disability Comparison
Cambodians
Koreans
5.4%
AMBULATORY DISABILITY
100.0/ 100
METRIC RATING
28th/ 347
METRIC RANK
5.9%
AMBULATORY DISABILITY
91.6/ 100
METRIC RATING
125th/ 347
METRIC RANK
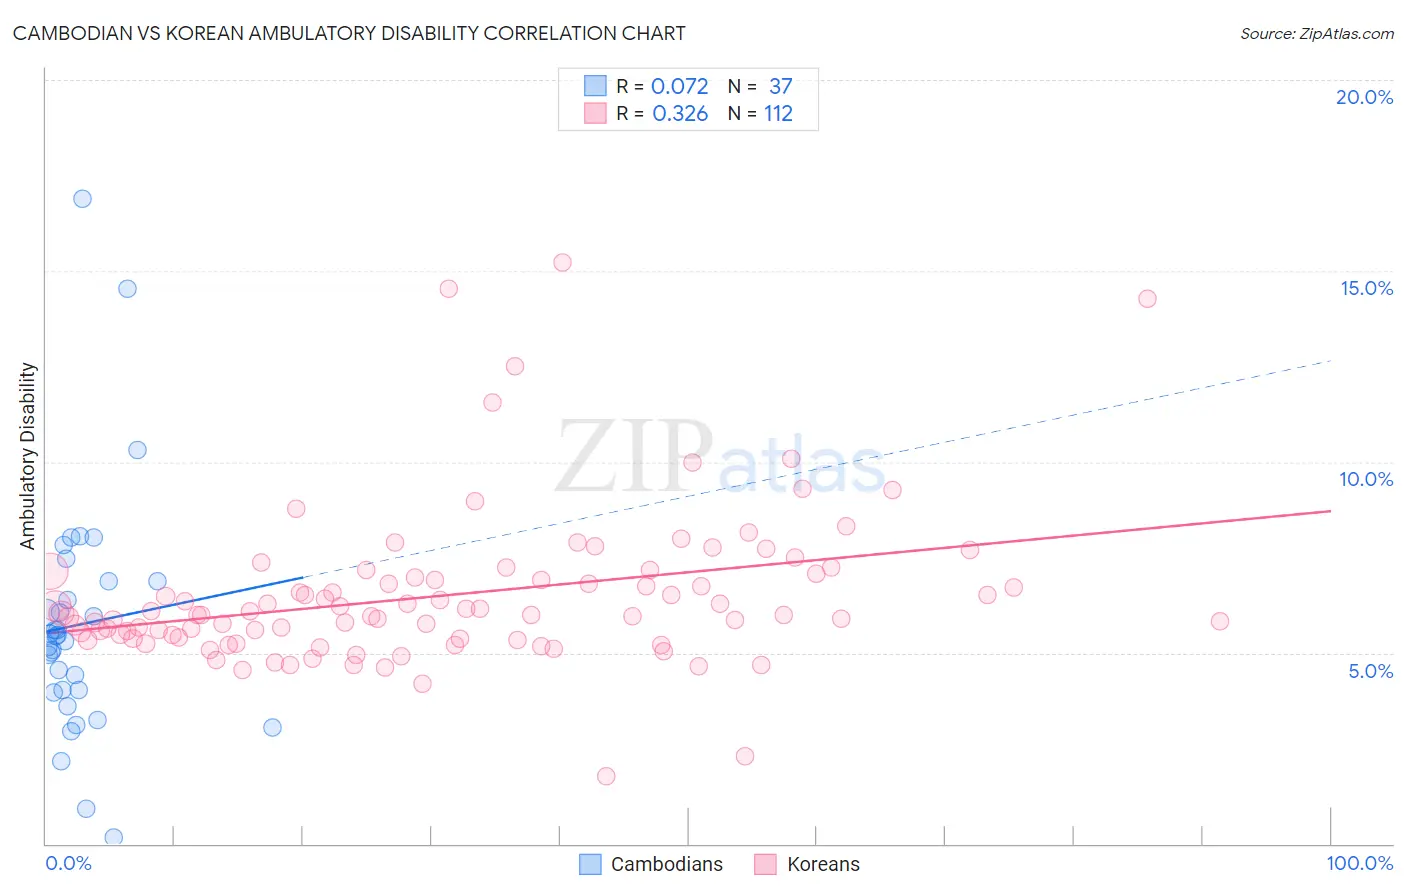
Cambodian vs Korean Ambulatory Disability Correlation Chart
The statistical analysis conducted on geographies consisting of 102,504,705 people shows a slight positive correlation between the proportion of Cambodians and percentage of population with ambulatory disability in the United States with a correlation coefficient (R) of 0.072 and weighted average of 5.4%. Similarly, the statistical analysis conducted on geographies consisting of 510,581,293 people shows a mild positive correlation between the proportion of Koreans and percentage of population with ambulatory disability in the United States with a correlation coefficient (R) of 0.326 and weighted average of 5.9%, a difference of 9.6%.
Ambulatory Disability Correlation Summary
| Measurement | Cambodian | Korean |
| Minimum | 0.17% | 1.8% |
| Maximum | 16.9% | 15.2% |
| Range | 16.7% | 13.4% |
| Mean | 5.7% | 6.5% |
| Median | 5.4% | 6.0% |
| Interquartile 25% (IQ1) | 4.0% | 5.4% |
| Interquartile 75% (IQ3) | 6.9% | 7.0% |
| Interquartile Range (IQR) | 2.9% | 1.6% |
| Standard Deviation (Sample) | 3.2% | 2.0% |
| Standard Deviation (Population) | 3.1% | 2.0% |
Similar Demographics by Ambulatory Disability
Demographics Similar to Cambodians by Ambulatory Disability
In terms of ambulatory disability, the demographic groups most similar to Cambodians are Asian (5.4%, a difference of 0.060%), Immigrants from Iran (5.4%, a difference of 0.10%), Immigrants from Nepal (5.4%, a difference of 0.22%), Zimbabwean (5.4%, a difference of 0.25%), and Immigrants from Saudi Arabia (5.4%, a difference of 0.33%).
| Demographics | Rating | Rank | Ambulatory Disability |
| Immigrants | Kuwait | 100.0 /100 | #21 | Exceptional 5.4% |
| Immigrants | Israel | 100.0 /100 | #22 | Exceptional 5.4% |
| Tongans | 100.0 /100 | #23 | Exceptional 5.4% |
| Immigrants | Saudi Arabia | 100.0 /100 | #24 | Exceptional 5.4% |
| Zimbabweans | 100.0 /100 | #25 | Exceptional 5.4% |
| Immigrants | Nepal | 100.0 /100 | #26 | Exceptional 5.4% |
| Asians | 100.0 /100 | #27 | Exceptional 5.4% |
| Cambodians | 100.0 /100 | #28 | Exceptional 5.4% |
| Immigrants | Iran | 100.0 /100 | #29 | Exceptional 5.4% |
| Immigrants | Turkey | 100.0 /100 | #30 | Exceptional 5.4% |
| Immigrants | Venezuela | 100.0 /100 | #31 | Exceptional 5.4% |
| Immigrants | Australia | 100.0 /100 | #32 | Exceptional 5.5% |
| Immigrants | Pakistan | 100.0 /100 | #33 | Exceptional 5.5% |
| Immigrants | Asia | 100.0 /100 | #34 | Exceptional 5.5% |
| Afghans | 100.0 /100 | #35 | Exceptional 5.5% |
Demographics Similar to Koreans by Ambulatory Disability
In terms of ambulatory disability, the demographic groups most similar to Koreans are Arab (5.9%, a difference of 0.020%), Immigrants from Nigeria (5.9%, a difference of 0.11%), Immigrants from Middle Africa (5.9%, a difference of 0.12%), Immigrants from Western Asia (5.9%, a difference of 0.15%), and Immigrants from Russia (5.9%, a difference of 0.16%).
| Demographics | Rating | Rank | Ambulatory Disability |
| Russians | 93.4 /100 | #118 | Exceptional 5.9% |
| Norwegians | 93.1 /100 | #119 | Exceptional 5.9% |
| Estonians | 92.9 /100 | #120 | Exceptional 5.9% |
| Costa Ricans | 92.6 /100 | #121 | Exceptional 5.9% |
| Icelanders | 92.6 /100 | #122 | Exceptional 5.9% |
| Immigrants | Russia | 92.4 /100 | #123 | Exceptional 5.9% |
| Immigrants | Middle Africa | 92.2 /100 | #124 | Exceptional 5.9% |
| Koreans | 91.6 /100 | #125 | Exceptional 5.9% |
| Arabs | 91.5 /100 | #126 | Exceptional 5.9% |
| Immigrants | Nigeria | 90.9 /100 | #127 | Exceptional 5.9% |
| Immigrants | Western Asia | 90.7 /100 | #128 | Exceptional 5.9% |
| Immigrants | Norway | 90.5 /100 | #129 | Exceptional 5.9% |
| Immigrants | Kazakhstan | 89.7 /100 | #130 | Excellent 5.9% |
| Immigrants | Costa Rica | 89.5 /100 | #131 | Excellent 5.9% |
| Immigrants | Europe | 87.8 /100 | #132 | Excellent 6.0% |