Immigrants from Uzbekistan vs Korean Ambulatory Disability
COMPARE
Immigrants from Uzbekistan
Korean
Ambulatory Disability
Ambulatory Disability Comparison
Immigrants from Uzbekistan
Koreans
6.5%
AMBULATORY DISABILITY
0.6/ 100
METRIC RATING
256th/ 347
METRIC RANK
5.9%
AMBULATORY DISABILITY
91.6/ 100
METRIC RATING
125th/ 347
METRIC RANK
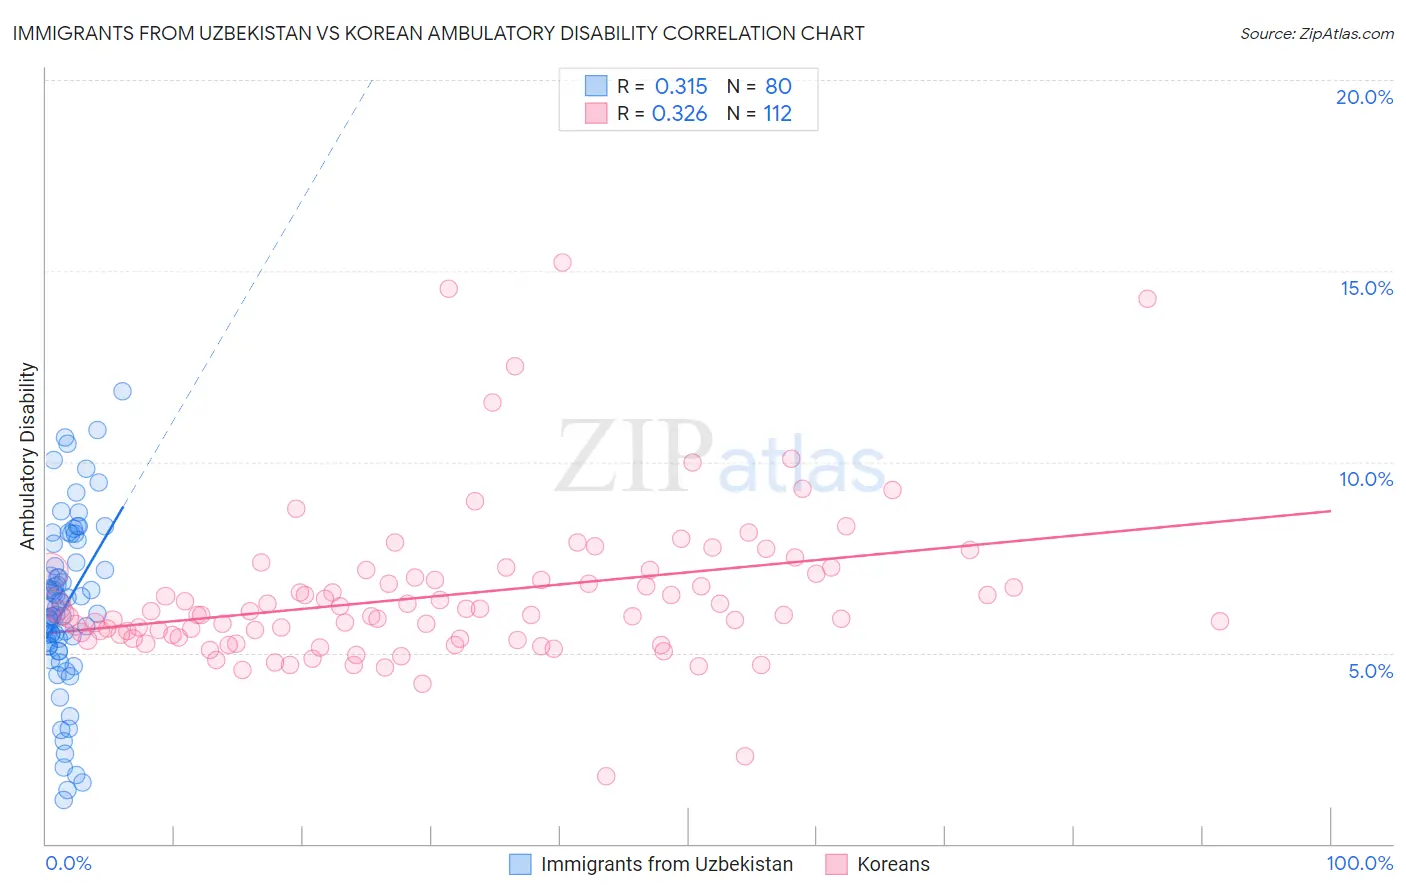
Immigrants from Uzbekistan vs Korean Ambulatory Disability Correlation Chart
The statistical analysis conducted on geographies consisting of 118,661,431 people shows a mild positive correlation between the proportion of Immigrants from Uzbekistan and percentage of population with ambulatory disability in the United States with a correlation coefficient (R) of 0.315 and weighted average of 6.5%. Similarly, the statistical analysis conducted on geographies consisting of 510,581,293 people shows a mild positive correlation between the proportion of Koreans and percentage of population with ambulatory disability in the United States with a correlation coefficient (R) of 0.326 and weighted average of 5.9%, a difference of 10.3%.
Ambulatory Disability Correlation Summary
| Measurement | Immigrants from Uzbekistan | Korean |
| Minimum | 1.2% | 1.8% |
| Maximum | 11.8% | 15.2% |
| Range | 10.7% | 13.4% |
| Mean | 6.2% | 6.5% |
| Median | 6.2% | 6.0% |
| Interquartile 25% (IQ1) | 5.2% | 5.4% |
| Interquartile 75% (IQ3) | 7.6% | 7.0% |
| Interquartile Range (IQR) | 2.4% | 1.6% |
| Standard Deviation (Sample) | 2.2% | 2.0% |
| Standard Deviation (Population) | 2.2% | 2.0% |
Similar Demographics by Ambulatory Disability
Demographics Similar to Immigrants from Uzbekistan by Ambulatory Disability
In terms of ambulatory disability, the demographic groups most similar to Immigrants from Uzbekistan are Welsh (6.5%, a difference of 0.080%), Bermudan (6.5%, a difference of 0.080%), Belizean (6.5%, a difference of 0.15%), Spanish American Indian (6.5%, a difference of 0.16%), and Scottish (6.5%, a difference of 0.30%).
| Demographics | Rating | Rank | Ambulatory Disability |
| Native Hawaiians | 1.1 /100 | #249 | Tragic 6.5% |
| Chinese | 1.0 /100 | #250 | Tragic 6.5% |
| Hawaiians | 0.9 /100 | #251 | Tragic 6.5% |
| Immigrants | Bahamas | 0.8 /100 | #252 | Tragic 6.5% |
| Scottish | 0.7 /100 | #253 | Tragic 6.5% |
| Belizeans | 0.7 /100 | #254 | Tragic 6.5% |
| Welsh | 0.6 /100 | #255 | Tragic 6.5% |
| Immigrants | Uzbekistan | 0.6 /100 | #256 | Tragic 6.5% |
| Bermudans | 0.5 /100 | #257 | Tragic 6.5% |
| Spanish American Indians | 0.5 /100 | #258 | Tragic 6.5% |
| Aleuts | 0.4 /100 | #259 | Tragic 6.6% |
| Immigrants | Belize | 0.4 /100 | #260 | Tragic 6.6% |
| Irish | 0.4 /100 | #261 | Tragic 6.6% |
| English | 0.4 /100 | #262 | Tragic 6.6% |
| Hmong | 0.3 /100 | #263 | Tragic 6.6% |
Demographics Similar to Koreans by Ambulatory Disability
In terms of ambulatory disability, the demographic groups most similar to Koreans are Arab (5.9%, a difference of 0.020%), Immigrants from Nigeria (5.9%, a difference of 0.11%), Immigrants from Middle Africa (5.9%, a difference of 0.12%), Immigrants from Western Asia (5.9%, a difference of 0.15%), and Immigrants from Russia (5.9%, a difference of 0.16%).
| Demographics | Rating | Rank | Ambulatory Disability |
| Russians | 93.4 /100 | #118 | Exceptional 5.9% |
| Norwegians | 93.1 /100 | #119 | Exceptional 5.9% |
| Estonians | 92.9 /100 | #120 | Exceptional 5.9% |
| Costa Ricans | 92.6 /100 | #121 | Exceptional 5.9% |
| Icelanders | 92.6 /100 | #122 | Exceptional 5.9% |
| Immigrants | Russia | 92.4 /100 | #123 | Exceptional 5.9% |
| Immigrants | Middle Africa | 92.2 /100 | #124 | Exceptional 5.9% |
| Koreans | 91.6 /100 | #125 | Exceptional 5.9% |
| Arabs | 91.5 /100 | #126 | Exceptional 5.9% |
| Immigrants | Nigeria | 90.9 /100 | #127 | Exceptional 5.9% |
| Immigrants | Western Asia | 90.7 /100 | #128 | Exceptional 5.9% |
| Immigrants | Norway | 90.5 /100 | #129 | Exceptional 5.9% |
| Immigrants | Kazakhstan | 89.7 /100 | #130 | Excellent 5.9% |
| Immigrants | Costa Rica | 89.5 /100 | #131 | Excellent 5.9% |
| Immigrants | Europe | 87.8 /100 | #132 | Excellent 6.0% |