Croatian vs Australian Hearing Disability
COMPARE
Croatian
Australian
Hearing Disability
Hearing Disability Comparison
Croatians
Australians
3.4%
HEARING DISABILITY
0.4/ 100
METRIC RATING
252nd/ 347
METRIC RANK
3.2%
HEARING DISABILITY
8.1/ 100
METRIC RATING
214th/ 347
METRIC RANK
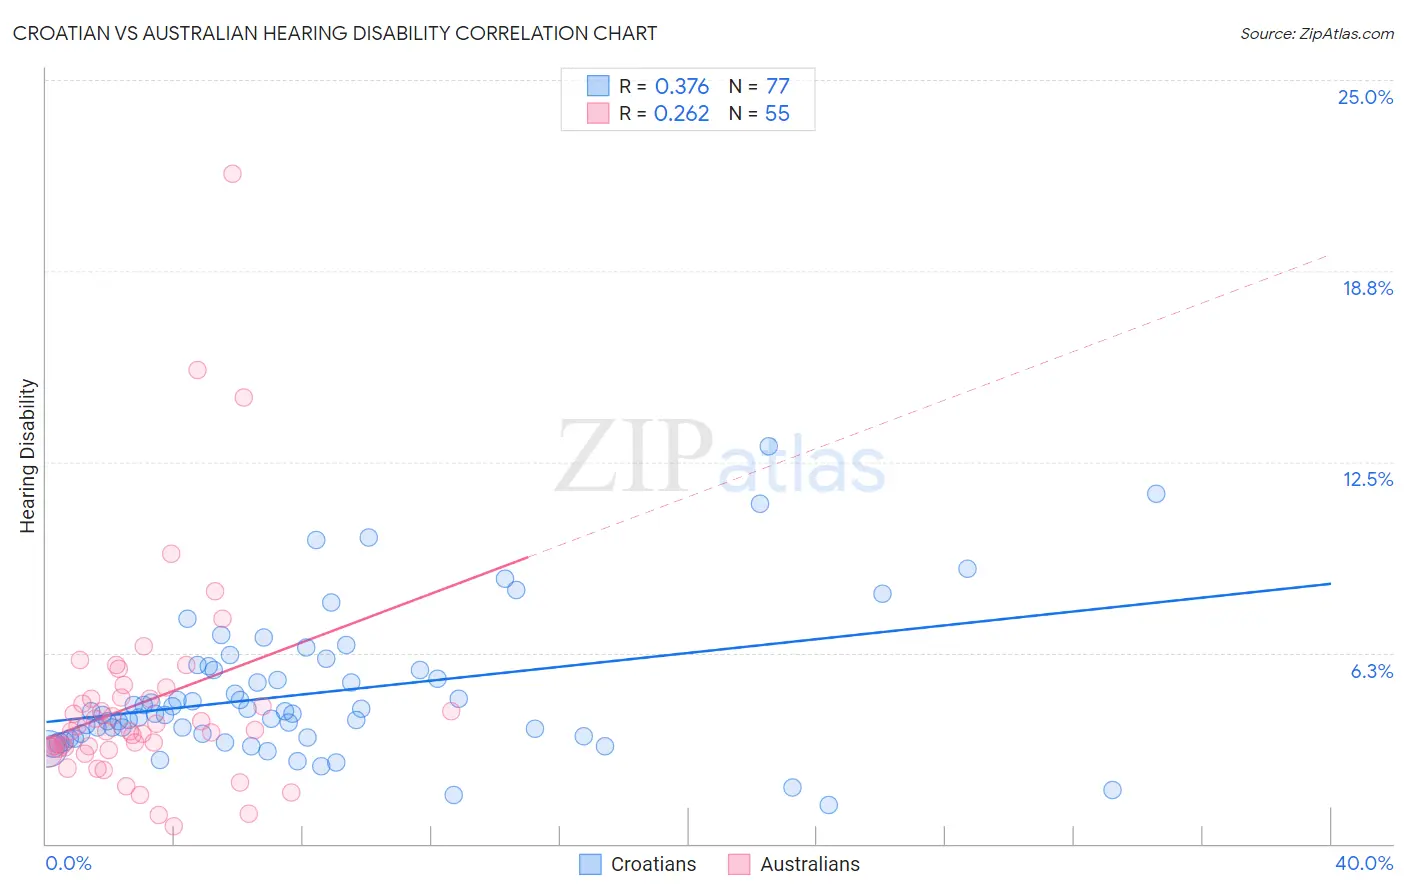
Croatian vs Australian Hearing Disability Correlation Chart
The statistical analysis conducted on geographies consisting of 375,644,002 people shows a mild positive correlation between the proportion of Croatians and percentage of population with hearing disability in the United States with a correlation coefficient (R) of 0.376 and weighted average of 3.4%. Similarly, the statistical analysis conducted on geographies consisting of 224,103,986 people shows a weak positive correlation between the proportion of Australians and percentage of population with hearing disability in the United States with a correlation coefficient (R) of 0.262 and weighted average of 3.2%, a difference of 7.1%.
Hearing Disability Correlation Summary
| Measurement | Croatian | Australian |
| Minimum | 1.3% | 0.57% |
| Maximum | 13.0% | 21.9% |
| Range | 11.7% | 21.4% |
| Mean | 4.9% | 4.6% |
| Median | 4.3% | 3.7% |
| Interquartile 25% (IQ1) | 3.5% | 3.1% |
| Interquartile 75% (IQ3) | 5.8% | 4.8% |
| Interquartile Range (IQR) | 2.3% | 1.7% |
| Standard Deviation (Sample) | 2.3% | 3.6% |
| Standard Deviation (Population) | 2.3% | 3.6% |
Similar Demographics by Hearing Disability
Demographics Similar to Croatians by Hearing Disability
In terms of hearing disability, the demographic groups most similar to Croatians are Hungarian (3.4%, a difference of 0.21%), Yuman (3.4%, a difference of 0.44%), Italian (3.4%, a difference of 0.45%), Carpatho Rusyn (3.4%, a difference of 0.45%), and Slavic (3.4%, a difference of 0.87%).
| Demographics | Rating | Rank | Hearing Disability |
| Immigrants | Scotland | 0.8 /100 | #245 | Tragic 3.3% |
| Immigrants | England | 0.7 /100 | #246 | Tragic 3.3% |
| Lithuanians | 0.6 /100 | #247 | Tragic 3.4% |
| Austrians | 0.6 /100 | #248 | Tragic 3.4% |
| Italians | 0.4 /100 | #249 | Tragic 3.4% |
| Yuman | 0.4 /100 | #250 | Tragic 3.4% |
| Hungarians | 0.4 /100 | #251 | Tragic 3.4% |
| Croatians | 0.4 /100 | #252 | Tragic 3.4% |
| Carpatho Rusyns | 0.3 /100 | #253 | Tragic 3.4% |
| Slavs | 0.2 /100 | #254 | Tragic 3.4% |
| Poles | 0.2 /100 | #255 | Tragic 3.4% |
| Hmong | 0.2 /100 | #256 | Tragic 3.4% |
| Yaqui | 0.2 /100 | #257 | Tragic 3.4% |
| Northern Europeans | 0.2 /100 | #258 | Tragic 3.4% |
| Slovenes | 0.1 /100 | #259 | Tragic 3.5% |
Demographics Similar to Australians by Hearing Disability
In terms of hearing disability, the demographic groups most similar to Australians are Bangladeshi (3.2%, a difference of 0.010%), Immigrants from Norway (3.2%, a difference of 0.25%), Russian (3.2%, a difference of 0.33%), Immigrants from Northern Europe (3.2%, a difference of 0.37%), and New Zealander (3.2%, a difference of 0.43%).
| Demographics | Rating | Rank | Hearing Disability |
| Hispanics or Latinos | 15.1 /100 | #207 | Poor 3.1% |
| Immigrants | Latvia | 12.7 /100 | #208 | Poor 3.1% |
| Immigrants | Hungary | 12.5 /100 | #209 | Poor 3.1% |
| Cape Verdeans | 12.2 /100 | #210 | Poor 3.1% |
| Romanians | 12.1 /100 | #211 | Poor 3.1% |
| Pakistanis | 11.1 /100 | #212 | Poor 3.1% |
| Immigrants | Iraq | 10.5 /100 | #213 | Poor 3.1% |
| Australians | 8.1 /100 | #214 | Tragic 3.2% |
| Bangladeshis | 8.1 /100 | #215 | Tragic 3.2% |
| Immigrants | Norway | 7.3 /100 | #216 | Tragic 3.2% |
| Russians | 7.1 /100 | #217 | Tragic 3.2% |
| Immigrants | Northern Europe | 7.0 /100 | #218 | Tragic 3.2% |
| New Zealanders | 6.8 /100 | #219 | Tragic 3.2% |
| Malaysians | 6.6 /100 | #220 | Tragic 3.2% |
| Immigrants | Laos | 6.6 /100 | #221 | Tragic 3.2% |