Croatian vs Cherokee Hearing Disability
COMPARE
Croatian
Cherokee
Hearing Disability
Hearing Disability Comparison
Croatians
Cherokee
3.4%
HEARING DISABILITY
0.4/ 100
METRIC RATING
252nd/ 347
METRIC RANK
4.2%
HEARING DISABILITY
0.0/ 100
METRIC RATING
331st/ 347
METRIC RANK
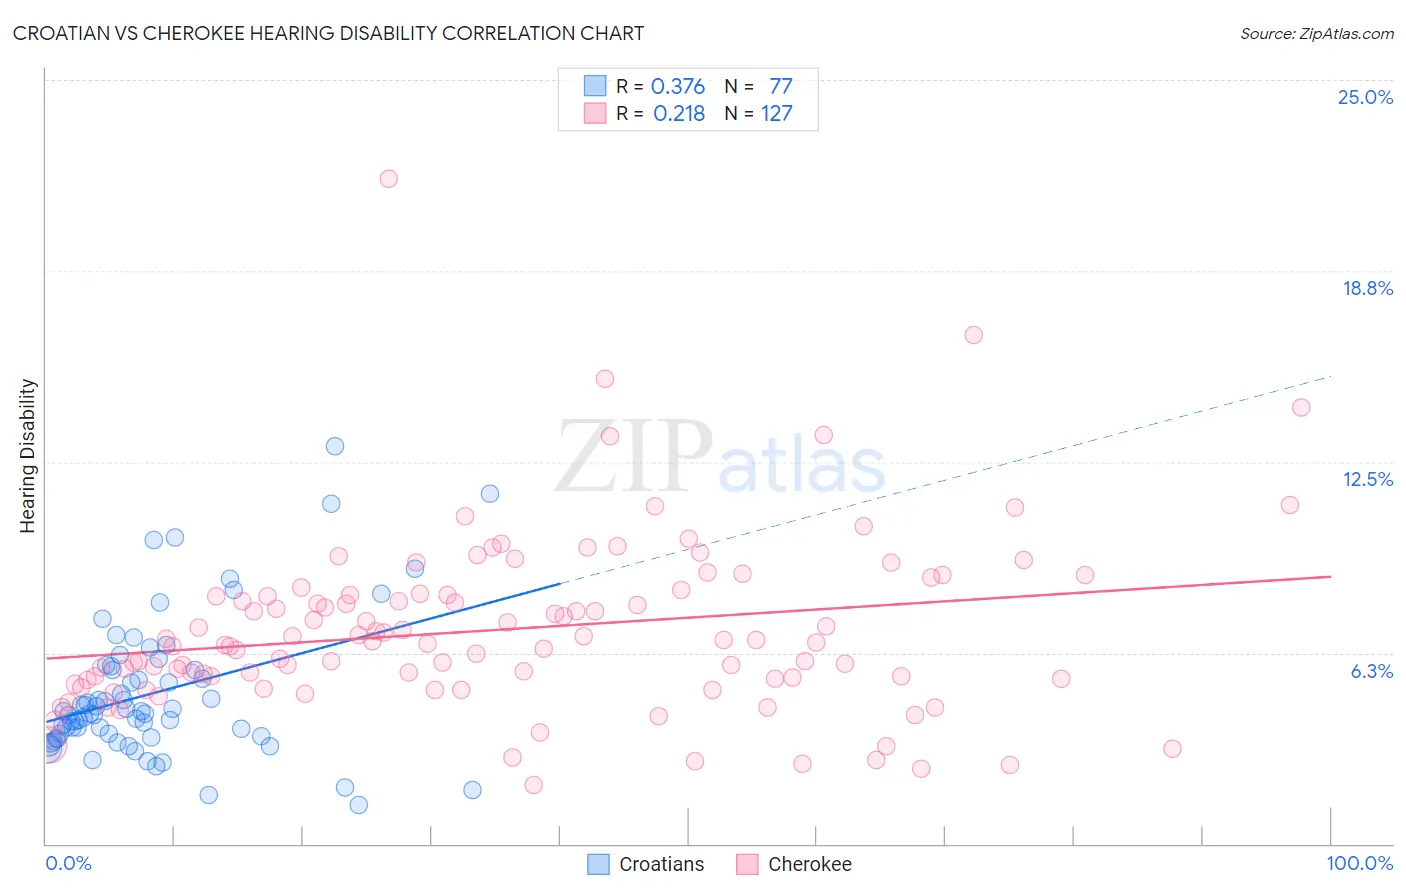
Croatian vs Cherokee Hearing Disability Correlation Chart
The statistical analysis conducted on geographies consisting of 375,644,002 people shows a mild positive correlation between the proportion of Croatians and percentage of population with hearing disability in the United States with a correlation coefficient (R) of 0.376 and weighted average of 3.4%. Similarly, the statistical analysis conducted on geographies consisting of 493,388,222 people shows a weak positive correlation between the proportion of Cherokee and percentage of population with hearing disability in the United States with a correlation coefficient (R) of 0.218 and weighted average of 4.2%, a difference of 24.0%.
Hearing Disability Correlation Summary
| Measurement | Croatian | Cherokee |
| Minimum | 1.3% | 1.9% |
| Maximum | 13.0% | 21.8% |
| Range | 11.7% | 19.8% |
| Mean | 4.9% | 7.0% |
| Median | 4.3% | 6.6% |
| Interquartile 25% (IQ1) | 3.5% | 5.4% |
| Interquartile 75% (IQ3) | 5.8% | 8.1% |
| Interquartile Range (IQR) | 2.3% | 2.8% |
| Standard Deviation (Sample) | 2.3% | 2.9% |
| Standard Deviation (Population) | 2.3% | 2.9% |
Similar Demographics by Hearing Disability
Demographics Similar to Croatians by Hearing Disability
In terms of hearing disability, the demographic groups most similar to Croatians are Hungarian (3.4%, a difference of 0.21%), Yuman (3.4%, a difference of 0.44%), Italian (3.4%, a difference of 0.45%), Carpatho Rusyn (3.4%, a difference of 0.45%), and Slavic (3.4%, a difference of 0.87%).
| Demographics | Rating | Rank | Hearing Disability |
| Immigrants | Scotland | 0.8 /100 | #245 | Tragic 3.3% |
| Immigrants | England | 0.7 /100 | #246 | Tragic 3.3% |
| Lithuanians | 0.6 /100 | #247 | Tragic 3.4% |
| Austrians | 0.6 /100 | #248 | Tragic 3.4% |
| Italians | 0.4 /100 | #249 | Tragic 3.4% |
| Yuman | 0.4 /100 | #250 | Tragic 3.4% |
| Hungarians | 0.4 /100 | #251 | Tragic 3.4% |
| Croatians | 0.4 /100 | #252 | Tragic 3.4% |
| Carpatho Rusyns | 0.3 /100 | #253 | Tragic 3.4% |
| Slavs | 0.2 /100 | #254 | Tragic 3.4% |
| Poles | 0.2 /100 | #255 | Tragic 3.4% |
| Hmong | 0.2 /100 | #256 | Tragic 3.4% |
| Yaqui | 0.2 /100 | #257 | Tragic 3.4% |
| Northern Europeans | 0.2 /100 | #258 | Tragic 3.4% |
| Slovenes | 0.1 /100 | #259 | Tragic 3.5% |
Demographics Similar to Cherokee by Hearing Disability
In terms of hearing disability, the demographic groups most similar to Cherokee are Native/Alaskan (4.2%, a difference of 0.15%), Houma (4.2%, a difference of 0.68%), Crow (4.2%, a difference of 0.94%), Tohono O'odham (4.2%, a difference of 0.95%), and Dutch West Indian (4.3%, a difference of 1.3%).
| Demographics | Rating | Rank | Hearing Disability |
| Osage | 0.0 /100 | #324 | Tragic 4.1% |
| Lumbee | 0.0 /100 | #325 | Tragic 4.1% |
| Potawatomi | 0.0 /100 | #326 | Tragic 4.1% |
| Arapaho | 0.0 /100 | #327 | Tragic 4.1% |
| Tohono O'odham | 0.0 /100 | #328 | Tragic 4.2% |
| Crow | 0.0 /100 | #329 | Tragic 4.2% |
| Natives/Alaskans | 0.0 /100 | #330 | Tragic 4.2% |
| Cherokee | 0.0 /100 | #331 | Tragic 4.2% |
| Houma | 0.0 /100 | #332 | Tragic 4.2% |
| Dutch West Indians | 0.0 /100 | #333 | Tragic 4.3% |
| Aleuts | 0.0 /100 | #334 | Tragic 4.3% |
| Kiowa | 0.0 /100 | #335 | Tragic 4.3% |
| Creek | 0.0 /100 | #336 | Tragic 4.4% |
| Chickasaw | 0.0 /100 | #337 | Tragic 4.5% |
| Alaska Natives | 0.0 /100 | #338 | Tragic 4.5% |