Croatian vs Australian 10th Grade
COMPARE
Croatian
Australian
10th Grade
10th Grade Comparison
Croatians
Australians
95.7%
10TH GRADE
100.0/ 100
METRIC RATING
10th/ 347
METRIC RANK
95.1%
10TH GRADE
99.9/ 100
METRIC RATING
48th/ 347
METRIC RANK
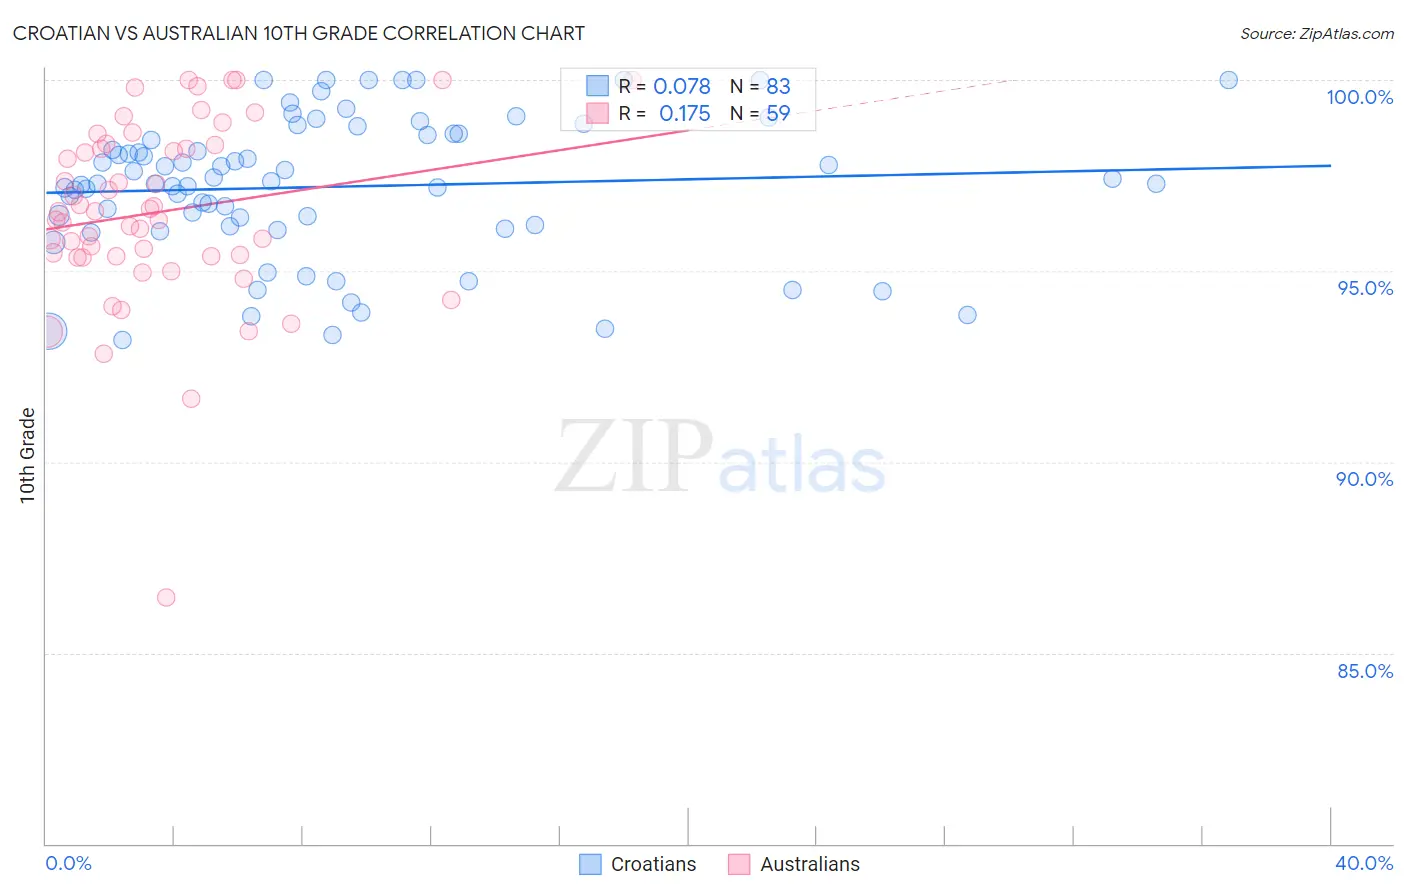
Croatian vs Australian 10th Grade Correlation Chart
The statistical analysis conducted on geographies consisting of 375,734,264 people shows a slight positive correlation between the proportion of Croatians and percentage of population with at least 10th grade education in the United States with a correlation coefficient (R) of 0.078 and weighted average of 95.7%. Similarly, the statistical analysis conducted on geographies consisting of 224,153,693 people shows a poor positive correlation between the proportion of Australians and percentage of population with at least 10th grade education in the United States with a correlation coefficient (R) of 0.175 and weighted average of 95.1%, a difference of 0.64%.
10th Grade Correlation Summary
| Measurement | Croatian | Australian |
| Minimum | 93.2% | 86.5% |
| Maximum | 100.0% | 100.0% |
| Range | 6.8% | 13.5% |
| Mean | 97.2% | 96.5% |
| Median | 97.3% | 96.5% |
| Interquartile 25% (IQ1) | 96.2% | 95.4% |
| Interquartile 75% (IQ3) | 98.6% | 98.3% |
| Interquartile Range (IQR) | 2.4% | 2.9% |
| Standard Deviation (Sample) | 1.8% | 2.4% |
| Standard Deviation (Population) | 1.8% | 2.4% |
Similar Demographics by 10th Grade
Demographics Similar to Croatians by 10th Grade
In terms of 10th grade, the demographic groups most similar to Croatians are Finnish (95.8%, a difference of 0.020%), Danish (95.7%, a difference of 0.040%), Lithuanian (95.8%, a difference of 0.080%), Tlingit-Haida (95.7%, a difference of 0.080%), and German (95.8%, a difference of 0.090%).
| Demographics | Rating | Rank | 10th Grade |
| Slovenes | 100.0 /100 | #3 | Exceptional 95.9% |
| Swedes | 100.0 /100 | #4 | Exceptional 95.9% |
| Carpatho Rusyns | 100.0 /100 | #5 | Exceptional 95.9% |
| Poles | 100.0 /100 | #6 | Exceptional 95.8% |
| Germans | 100.0 /100 | #7 | Exceptional 95.8% |
| Lithuanians | 100.0 /100 | #8 | Exceptional 95.8% |
| Finns | 100.0 /100 | #9 | Exceptional 95.8% |
| Croatians | 100.0 /100 | #10 | Exceptional 95.7% |
| Danes | 100.0 /100 | #11 | Exceptional 95.7% |
| Tlingit-Haida | 100.0 /100 | #12 | Exceptional 95.7% |
| English | 100.0 /100 | #13 | Exceptional 95.6% |
| Tsimshian | 100.0 /100 | #14 | Exceptional 95.6% |
| Irish | 100.0 /100 | #15 | Exceptional 95.6% |
| Scottish | 100.0 /100 | #16 | Exceptional 95.6% |
| Latvians | 100.0 /100 | #17 | Exceptional 95.6% |
Demographics Similar to Australians by 10th Grade
In terms of 10th grade, the demographic groups most similar to Australians are Czechoslovakian (95.1%, a difference of 0.020%), Serbian (95.1%, a difference of 0.020%), Immigrants from Northern Europe (95.2%, a difference of 0.030%), Greek (95.2%, a difference of 0.030%), and Immigrants from Austria (95.1%, a difference of 0.030%).
| Demographics | Rating | Rank | 10th Grade |
| Russians | 99.9 /100 | #41 | Exceptional 95.2% |
| Slavs | 99.9 /100 | #42 | Exceptional 95.2% |
| Macedonians | 99.9 /100 | #43 | Exceptional 95.2% |
| Immigrants | Northern Europe | 99.9 /100 | #44 | Exceptional 95.2% |
| Greeks | 99.9 /100 | #45 | Exceptional 95.2% |
| Czechoslovakians | 99.9 /100 | #46 | Exceptional 95.1% |
| Serbians | 99.9 /100 | #47 | Exceptional 95.1% |
| Australians | 99.9 /100 | #48 | Exceptional 95.1% |
| Immigrants | Austria | 99.9 /100 | #49 | Exceptional 95.1% |
| Immigrants | Canada | 99.8 /100 | #50 | Exceptional 95.1% |
| Austrians | 99.8 /100 | #51 | Exceptional 95.1% |
| Ottawa | 99.8 /100 | #52 | Exceptional 95.1% |
| Immigrants | North America | 99.8 /100 | #53 | Exceptional 95.0% |
| Immigrants | Lithuania | 99.8 /100 | #54 | Exceptional 95.0% |
| Immigrants | Ireland | 99.8 /100 | #55 | Exceptional 95.0% |