Immigrants from Croatia vs Australian Hearing Disability
COMPARE
Immigrants from Croatia
Australian
Hearing Disability
Hearing Disability Comparison
Immigrants from Croatia
Australians
3.1%
HEARING DISABILITY
20.5/ 100
METRIC RATING
198th/ 347
METRIC RANK
3.2%
HEARING DISABILITY
8.1/ 100
METRIC RATING
214th/ 347
METRIC RANK
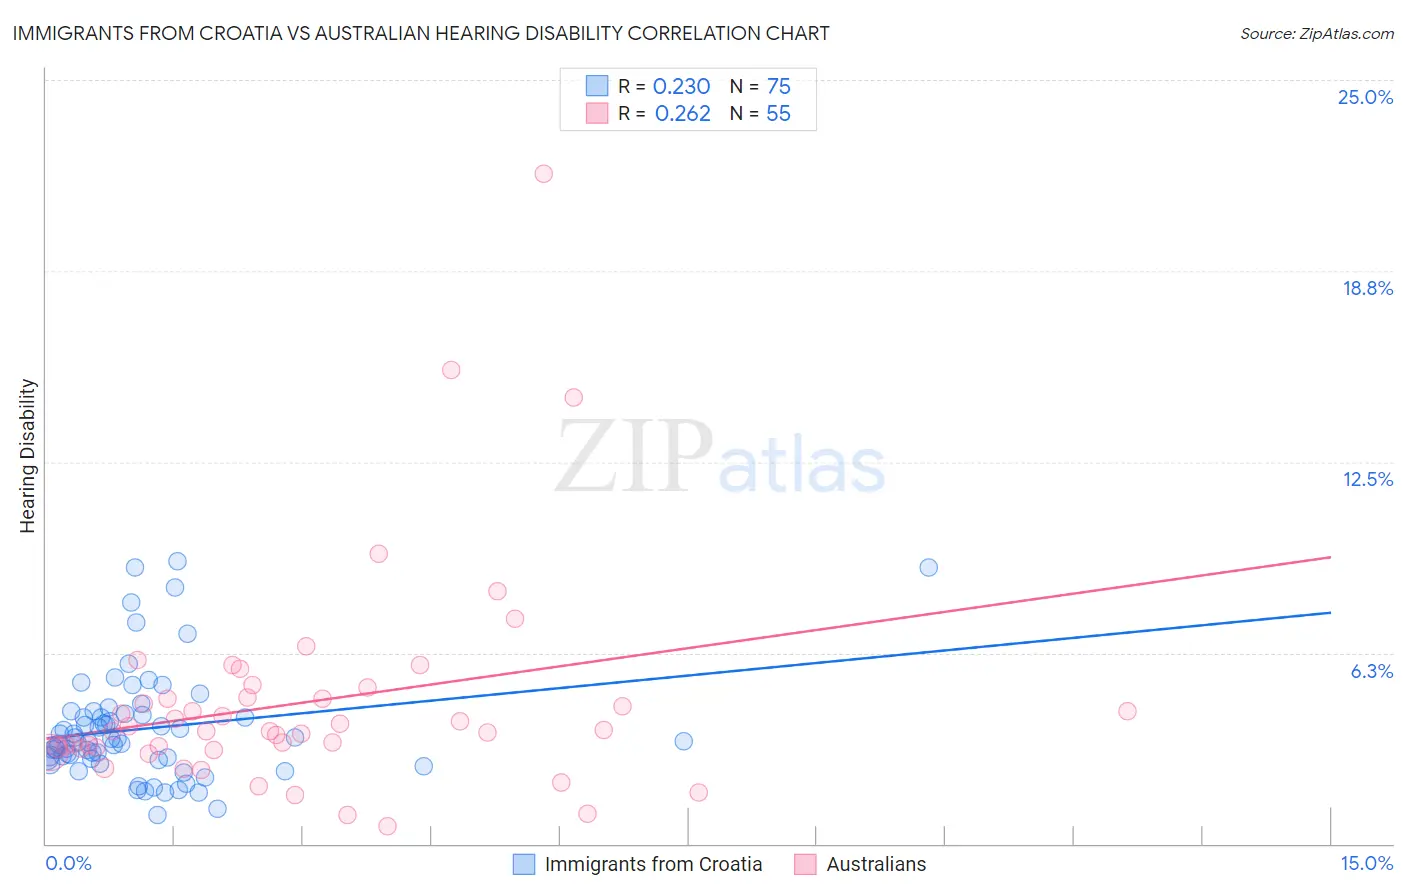
Immigrants from Croatia vs Australian Hearing Disability Correlation Chart
The statistical analysis conducted on geographies consisting of 132,571,835 people shows a weak positive correlation between the proportion of Immigrants from Croatia and percentage of population with hearing disability in the United States with a correlation coefficient (R) of 0.230 and weighted average of 3.1%. Similarly, the statistical analysis conducted on geographies consisting of 224,103,986 people shows a weak positive correlation between the proportion of Australians and percentage of population with hearing disability in the United States with a correlation coefficient (R) of 0.262 and weighted average of 3.2%, a difference of 2.4%.
Hearing Disability Correlation Summary
| Measurement | Immigrants from Croatia | Australian |
| Minimum | 0.95% | 0.57% |
| Maximum | 9.2% | 21.9% |
| Range | 8.3% | 21.4% |
| Mean | 3.8% | 4.6% |
| Median | 3.4% | 3.7% |
| Interquartile 25% (IQ1) | 2.8% | 3.1% |
| Interquartile 75% (IQ3) | 4.2% | 4.8% |
| Interquartile Range (IQR) | 1.5% | 1.7% |
| Standard Deviation (Sample) | 1.8% | 3.6% |
| Standard Deviation (Population) | 1.8% | 3.6% |
Demographics Similar to Immigrants from Croatia and Australians by Hearing Disability
In terms of hearing disability, the demographic groups most similar to Immigrants from Croatia are Immigrants from Bosnia and Herzegovina (3.1%, a difference of 0.020%), Syrian (3.1%, a difference of 0.18%), Immigrants from North Macedonia (3.1%, a difference of 0.19%), Iraqi (3.1%, a difference of 0.22%), and Immigrants from Europe (3.1%, a difference of 0.32%). Similarly, the demographic groups most similar to Australians are Bangladeshi (3.2%, a difference of 0.010%), Immigrants from Norway (3.2%, a difference of 0.25%), Immigrants from Iraq (3.1%, a difference of 0.62%), Pakistani (3.1%, a difference of 0.77%), and Romanian (3.1%, a difference of 0.98%).
| Demographics | Rating | Rank | Hearing Disability |
| Immigrants | Europe | 22.9 /100 | #196 | Fair 3.1% |
| Immigrants | Bosnia and Herzegovina | 20.6 /100 | #197 | Fair 3.1% |
| Immigrants | Croatia | 20.5 /100 | #198 | Fair 3.1% |
| Syrians | 19.2 /100 | #199 | Poor 3.1% |
| Immigrants | North Macedonia | 19.1 /100 | #200 | Poor 3.1% |
| Iraqis | 19.0 /100 | #201 | Poor 3.1% |
| Immigrants | Thailand | 16.4 /100 | #202 | Poor 3.1% |
| Immigrants | Denmark | 16.2 /100 | #203 | Poor 3.1% |
| Immigrants | Czechoslovakia | 15.9 /100 | #204 | Poor 3.1% |
| Alsatians | 15.9 /100 | #205 | Poor 3.1% |
| Eastern Europeans | 15.5 /100 | #206 | Poor 3.1% |
| Hispanics or Latinos | 15.1 /100 | #207 | Poor 3.1% |
| Immigrants | Latvia | 12.7 /100 | #208 | Poor 3.1% |
| Immigrants | Hungary | 12.5 /100 | #209 | Poor 3.1% |
| Cape Verdeans | 12.2 /100 | #210 | Poor 3.1% |
| Romanians | 12.1 /100 | #211 | Poor 3.1% |
| Pakistanis | 11.1 /100 | #212 | Poor 3.1% |
| Immigrants | Iraq | 10.5 /100 | #213 | Poor 3.1% |
| Australians | 8.1 /100 | #214 | Tragic 3.2% |
| Bangladeshis | 8.1 /100 | #215 | Tragic 3.2% |
| Immigrants | Norway | 7.3 /100 | #216 | Tragic 3.2% |