Croatian vs Immigrants from Syria Hearing Disability
COMPARE
Croatian
Immigrants from Syria
Hearing Disability
Hearing Disability Comparison
Croatians
Immigrants from Syria
3.4%
HEARING DISABILITY
0.4/ 100
METRIC RATING
252nd/ 347
METRIC RANK
2.9%
HEARING DISABILITY
85.8/ 100
METRIC RATING
133rd/ 347
METRIC RANK
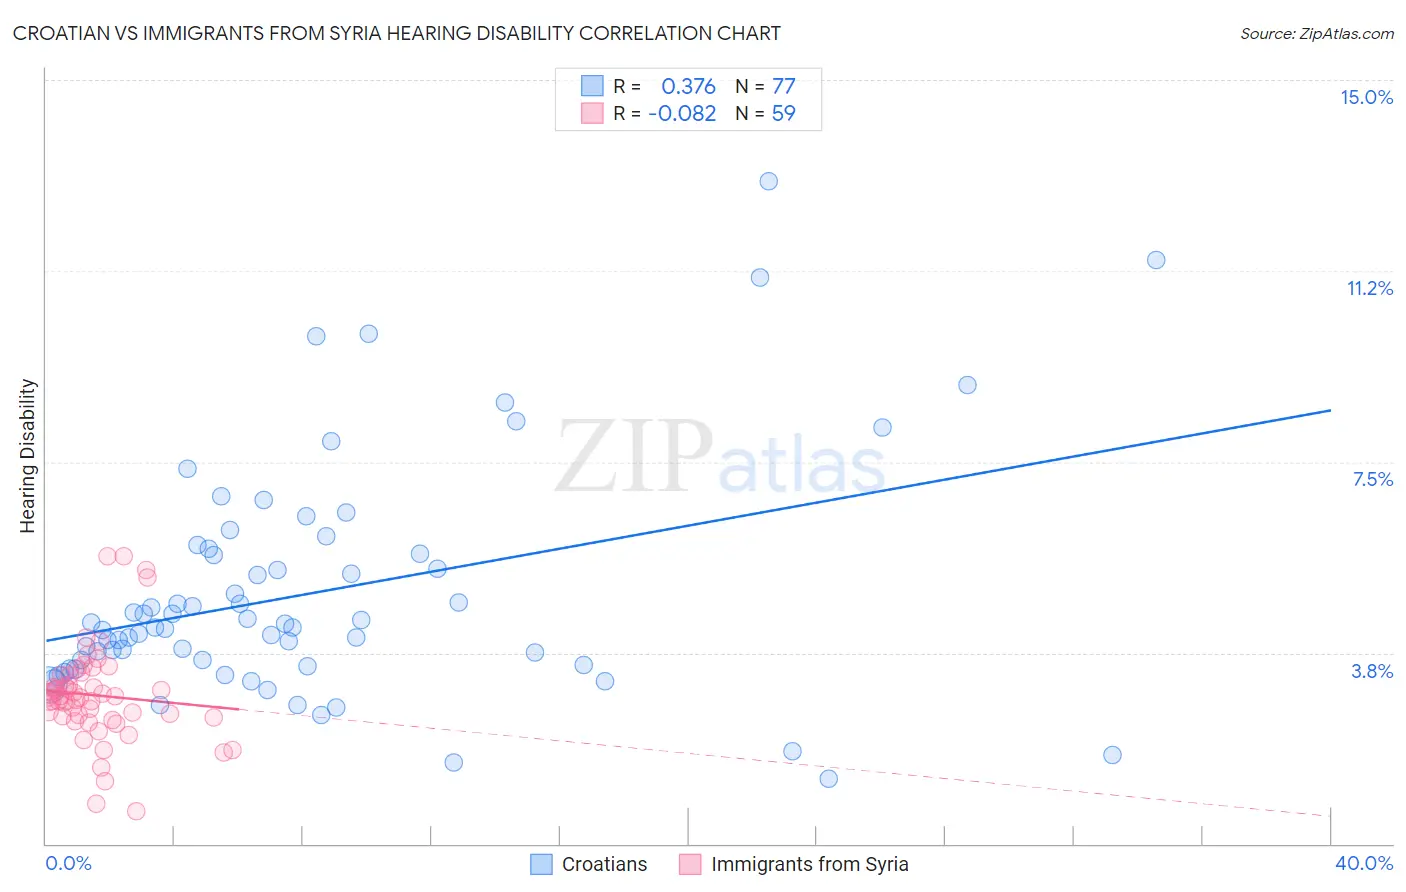
Croatian vs Immigrants from Syria Hearing Disability Correlation Chart
The statistical analysis conducted on geographies consisting of 375,644,002 people shows a mild positive correlation between the proportion of Croatians and percentage of population with hearing disability in the United States with a correlation coefficient (R) of 0.376 and weighted average of 3.4%. Similarly, the statistical analysis conducted on geographies consisting of 174,100,459 people shows a slight negative correlation between the proportion of Immigrants from Syria and percentage of population with hearing disability in the United States with a correlation coefficient (R) of -0.082 and weighted average of 2.9%, a difference of 18.2%.
Hearing Disability Correlation Summary
| Measurement | Croatian | Immigrants from Syria |
| Minimum | 1.3% | 0.64% |
| Maximum | 13.0% | 5.7% |
| Range | 11.7% | 5.0% |
| Mean | 4.9% | 2.9% |
| Median | 4.3% | 2.9% |
| Interquartile 25% (IQ1) | 3.5% | 2.5% |
| Interquartile 75% (IQ3) | 5.8% | 3.3% |
| Interquartile Range (IQR) | 2.3% | 0.85% |
| Standard Deviation (Sample) | 2.3% | 0.97% |
| Standard Deviation (Population) | 2.3% | 0.96% |
Similar Demographics by Hearing Disability
Demographics Similar to Croatians by Hearing Disability
In terms of hearing disability, the demographic groups most similar to Croatians are Hungarian (3.4%, a difference of 0.21%), Yuman (3.4%, a difference of 0.44%), Italian (3.4%, a difference of 0.45%), Carpatho Rusyn (3.4%, a difference of 0.45%), and Slavic (3.4%, a difference of 0.87%).
| Demographics | Rating | Rank | Hearing Disability |
| Immigrants | Scotland | 0.8 /100 | #245 | Tragic 3.3% |
| Immigrants | England | 0.7 /100 | #246 | Tragic 3.3% |
| Lithuanians | 0.6 /100 | #247 | Tragic 3.4% |
| Austrians | 0.6 /100 | #248 | Tragic 3.4% |
| Italians | 0.4 /100 | #249 | Tragic 3.4% |
| Yuman | 0.4 /100 | #250 | Tragic 3.4% |
| Hungarians | 0.4 /100 | #251 | Tragic 3.4% |
| Croatians | 0.4 /100 | #252 | Tragic 3.4% |
| Carpatho Rusyns | 0.3 /100 | #253 | Tragic 3.4% |
| Slavs | 0.2 /100 | #254 | Tragic 3.4% |
| Poles | 0.2 /100 | #255 | Tragic 3.4% |
| Hmong | 0.2 /100 | #256 | Tragic 3.4% |
| Yaqui | 0.2 /100 | #257 | Tragic 3.4% |
| Northern Europeans | 0.2 /100 | #258 | Tragic 3.4% |
| Slovenes | 0.1 /100 | #259 | Tragic 3.5% |
Demographics Similar to Immigrants from Syria by Hearing Disability
In terms of hearing disability, the demographic groups most similar to Immigrants from Syria are Chilean (2.9%, a difference of 0.0%), Immigrants from Kenya (2.9%, a difference of 0.060%), Ugandan (2.9%, a difference of 0.070%), Immigrants from Vietnam (2.9%, a difference of 0.14%), and Immigrants from Uganda (2.9%, a difference of 0.16%).
| Demographics | Rating | Rank | Hearing Disability |
| Immigrants | Sudan | 87.8 /100 | #126 | Excellent 2.9% |
| South American Indians | 86.9 /100 | #127 | Excellent 2.9% |
| Immigrants | Western Asia | 86.9 /100 | #128 | Excellent 2.9% |
| Immigrants | Uganda | 86.6 /100 | #129 | Excellent 2.9% |
| Immigrants | Vietnam | 86.5 /100 | #130 | Excellent 2.9% |
| Immigrants | Kenya | 86.1 /100 | #131 | Excellent 2.9% |
| Chileans | 85.8 /100 | #132 | Excellent 2.9% |
| Immigrants | Syria | 85.8 /100 | #133 | Excellent 2.9% |
| Ugandans | 85.5 /100 | #134 | Excellent 2.9% |
| Soviet Union | 84.8 /100 | #135 | Excellent 2.9% |
| Immigrants | Brazil | 84.6 /100 | #136 | Excellent 2.9% |
| Sri Lankans | 84.1 /100 | #137 | Excellent 2.9% |
| Immigrants | Costa Rica | 84.0 /100 | #138 | Excellent 2.9% |
| Bermudans | 83.8 /100 | #139 | Excellent 2.9% |
| Immigrants | Jordan | 83.7 /100 | #140 | Excellent 2.9% |