Immigrants from Iran vs Australian Hearing Disability
COMPARE
Immigrants from Iran
Australian
Hearing Disability
Hearing Disability Comparison
Immigrants from Iran
Australians
2.8%
HEARING DISABILITY
96.8/ 100
METRIC RATING
86th/ 347
METRIC RANK
3.2%
HEARING DISABILITY
8.1/ 100
METRIC RATING
214th/ 347
METRIC RANK
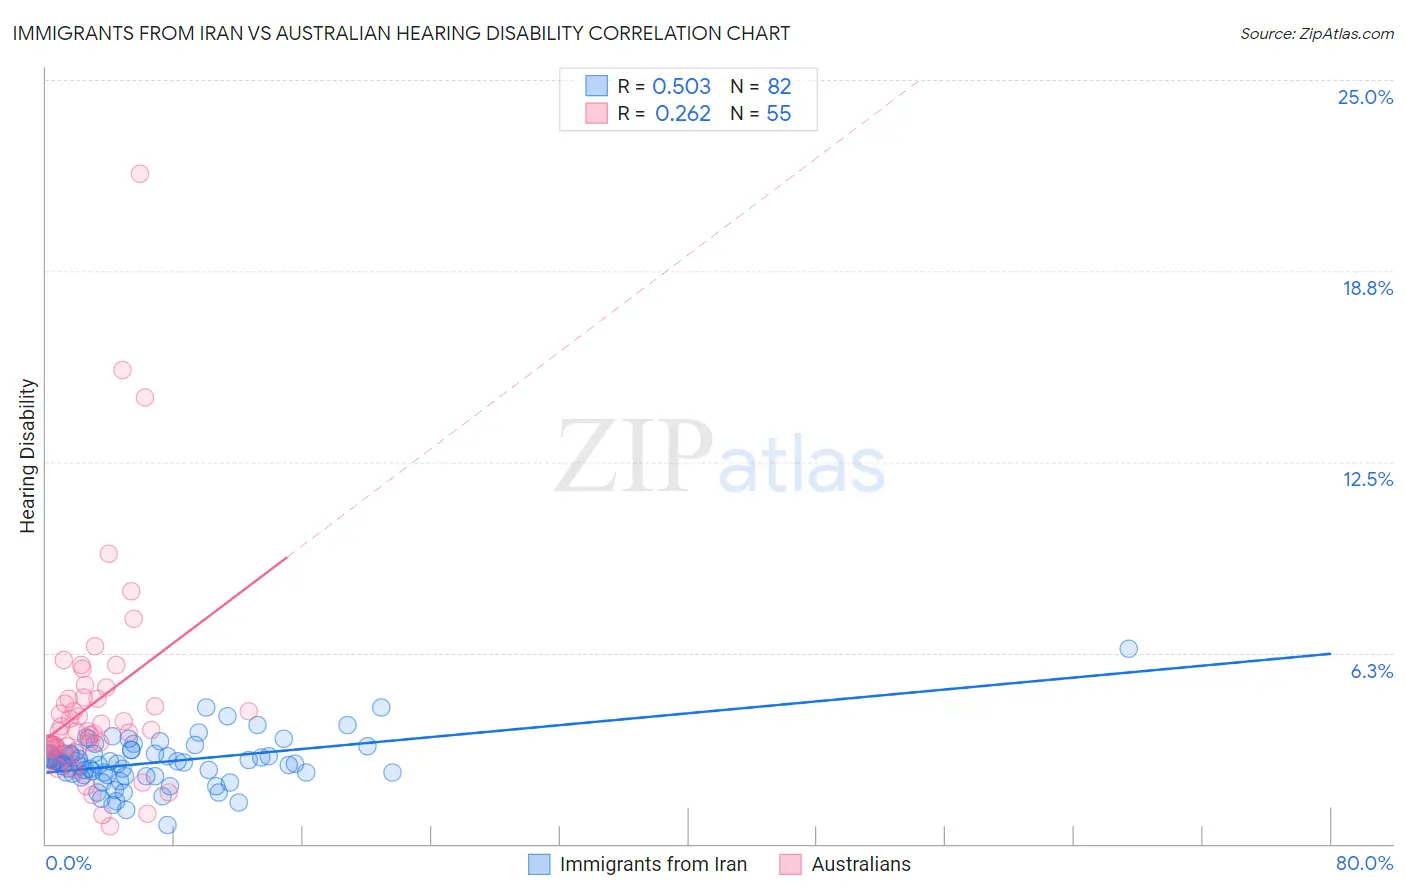
Immigrants from Iran vs Australian Hearing Disability Correlation Chart
The statistical analysis conducted on geographies consisting of 279,867,753 people shows a substantial positive correlation between the proportion of Immigrants from Iran and percentage of population with hearing disability in the United States with a correlation coefficient (R) of 0.503 and weighted average of 2.8%. Similarly, the statistical analysis conducted on geographies consisting of 224,103,986 people shows a weak positive correlation between the proportion of Australians and percentage of population with hearing disability in the United States with a correlation coefficient (R) of 0.262 and weighted average of 3.2%, a difference of 14.9%.
Hearing Disability Correlation Summary
| Measurement | Immigrants from Iran | Australian |
| Minimum | 0.60% | 0.57% |
| Maximum | 6.4% | 21.9% |
| Range | 5.8% | 21.4% |
| Mean | 2.7% | 4.6% |
| Median | 2.7% | 3.7% |
| Interquartile 25% (IQ1) | 2.2% | 3.1% |
| Interquartile 75% (IQ3) | 3.0% | 4.8% |
| Interquartile Range (IQR) | 0.74% | 1.7% |
| Standard Deviation (Sample) | 0.83% | 3.6% |
| Standard Deviation (Population) | 0.82% | 3.6% |
Similar Demographics by Hearing Disability
Demographics Similar to Immigrants from Iran by Hearing Disability
In terms of hearing disability, the demographic groups most similar to Immigrants from Iran are Immigrants from Northern Africa (2.8%, a difference of 0.020%), Immigrants from Argentina (2.8%, a difference of 0.10%), Somali (2.8%, a difference of 0.11%), Immigrants from Turkey (2.8%, a difference of 0.14%), and Belizean (2.8%, a difference of 0.17%).
| Demographics | Rating | Rank | Hearing Disability |
| Colombians | 97.4 /100 | #79 | Exceptional 2.7% |
| Immigrants | Asia | 97.2 /100 | #80 | Exceptional 2.7% |
| Immigrants | Uruguay | 97.2 /100 | #81 | Exceptional 2.7% |
| Immigrants | Armenia | 97.2 /100 | #82 | Exceptional 2.7% |
| Immigrants | Cuba | 97.2 /100 | #83 | Exceptional 2.7% |
| Immigrants | Argentina | 97.0 /100 | #84 | Exceptional 2.8% |
| Immigrants | Northern Africa | 96.9 /100 | #85 | Exceptional 2.8% |
| Immigrants | Iran | 96.8 /100 | #86 | Exceptional 2.8% |
| Somalis | 96.7 /100 | #87 | Exceptional 2.8% |
| Immigrants | Turkey | 96.7 /100 | #88 | Exceptional 2.8% |
| Belizeans | 96.6 /100 | #89 | Exceptional 2.8% |
| Immigrants | Morocco | 96.6 /100 | #90 | Exceptional 2.8% |
| Immigrants | Middle Africa | 96.5 /100 | #91 | Exceptional 2.8% |
| Iranians | 96.4 /100 | #92 | Exceptional 2.8% |
| Immigrants | Kuwait | 96.3 /100 | #93 | Exceptional 2.8% |
Demographics Similar to Australians by Hearing Disability
In terms of hearing disability, the demographic groups most similar to Australians are Bangladeshi (3.2%, a difference of 0.010%), Immigrants from Norway (3.2%, a difference of 0.25%), Russian (3.2%, a difference of 0.33%), Immigrants from Northern Europe (3.2%, a difference of 0.37%), and New Zealander (3.2%, a difference of 0.43%).
| Demographics | Rating | Rank | Hearing Disability |
| Hispanics or Latinos | 15.1 /100 | #207 | Poor 3.1% |
| Immigrants | Latvia | 12.7 /100 | #208 | Poor 3.1% |
| Immigrants | Hungary | 12.5 /100 | #209 | Poor 3.1% |
| Cape Verdeans | 12.2 /100 | #210 | Poor 3.1% |
| Romanians | 12.1 /100 | #211 | Poor 3.1% |
| Pakistanis | 11.1 /100 | #212 | Poor 3.1% |
| Immigrants | Iraq | 10.5 /100 | #213 | Poor 3.1% |
| Australians | 8.1 /100 | #214 | Tragic 3.2% |
| Bangladeshis | 8.1 /100 | #215 | Tragic 3.2% |
| Immigrants | Norway | 7.3 /100 | #216 | Tragic 3.2% |
| Russians | 7.1 /100 | #217 | Tragic 3.2% |
| Immigrants | Northern Europe | 7.0 /100 | #218 | Tragic 3.2% |
| New Zealanders | 6.8 /100 | #219 | Tragic 3.2% |
| Malaysians | 6.6 /100 | #220 | Tragic 3.2% |
| Immigrants | Laos | 6.6 /100 | #221 | Tragic 3.2% |