Croatian vs Immigrants from Uruguay Hearing Disability
COMPARE
Croatian
Immigrants from Uruguay
Hearing Disability
Hearing Disability Comparison
Croatians
Immigrants from Uruguay
3.4%
HEARING DISABILITY
0.4/ 100
METRIC RATING
252nd/ 347
METRIC RANK
2.7%
HEARING DISABILITY
97.2/ 100
METRIC RATING
81st/ 347
METRIC RANK
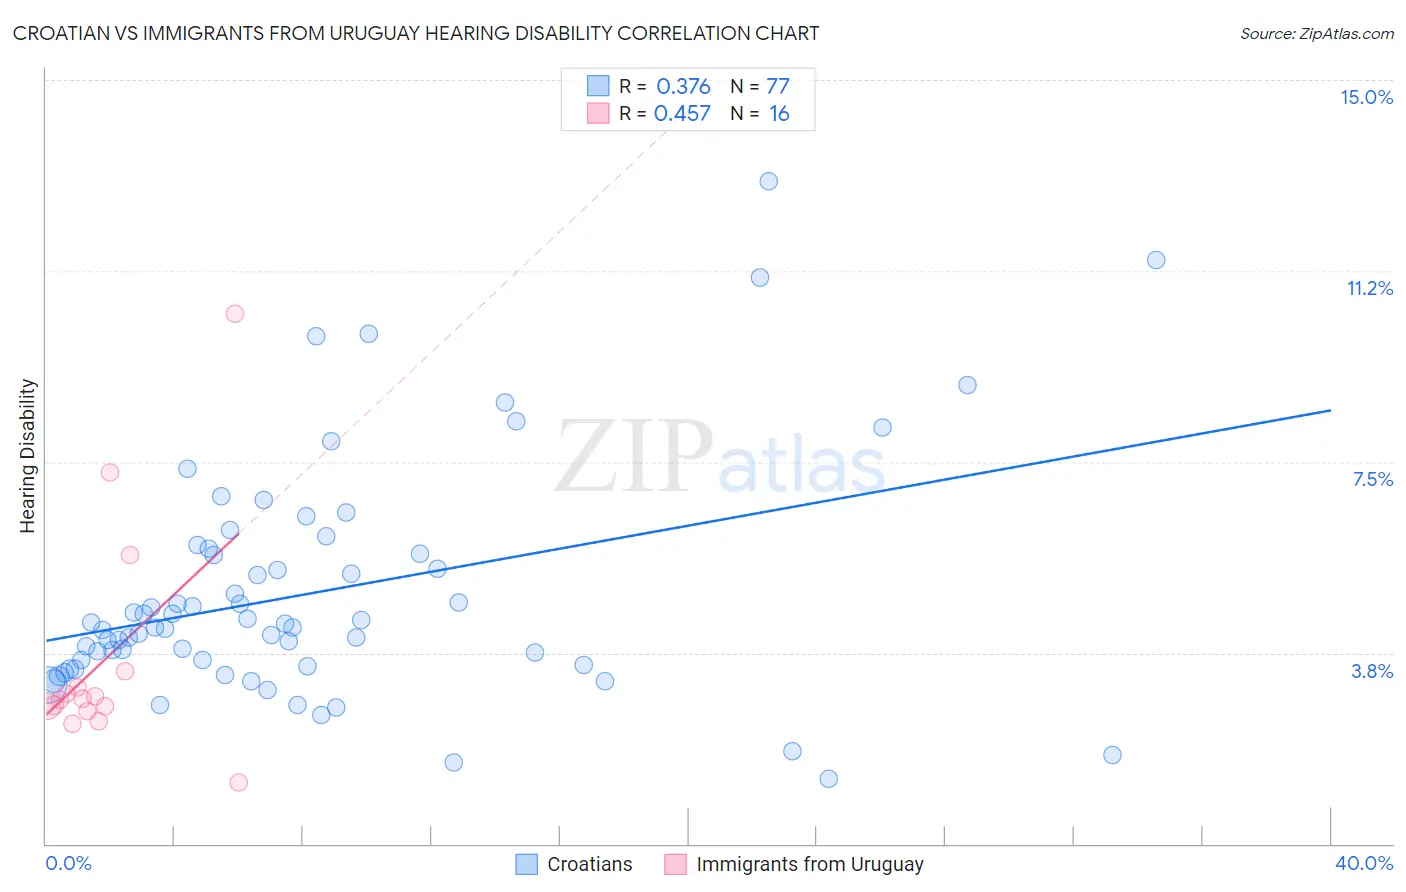
Croatian vs Immigrants from Uruguay Hearing Disability Correlation Chart
The statistical analysis conducted on geographies consisting of 375,644,002 people shows a mild positive correlation between the proportion of Croatians and percentage of population with hearing disability in the United States with a correlation coefficient (R) of 0.376 and weighted average of 3.4%. Similarly, the statistical analysis conducted on geographies consisting of 133,251,950 people shows a moderate positive correlation between the proportion of Immigrants from Uruguay and percentage of population with hearing disability in the United States with a correlation coefficient (R) of 0.457 and weighted average of 2.7%, a difference of 23.5%.
Hearing Disability Correlation Summary
| Measurement | Croatian | Immigrants from Uruguay |
| Minimum | 1.3% | 1.2% |
| Maximum | 13.0% | 10.4% |
| Range | 11.7% | 9.2% |
| Mean | 4.9% | 3.6% |
| Median | 4.3% | 2.8% |
| Interquartile 25% (IQ1) | 3.5% | 2.6% |
| Interquartile 75% (IQ3) | 5.8% | 3.2% |
| Interquartile Range (IQR) | 2.3% | 0.58% |
| Standard Deviation (Sample) | 2.3% | 2.3% |
| Standard Deviation (Population) | 2.3% | 2.2% |
Similar Demographics by Hearing Disability
Demographics Similar to Croatians by Hearing Disability
In terms of hearing disability, the demographic groups most similar to Croatians are Hungarian (3.4%, a difference of 0.21%), Yuman (3.4%, a difference of 0.44%), Italian (3.4%, a difference of 0.45%), Carpatho Rusyn (3.4%, a difference of 0.45%), and Slavic (3.4%, a difference of 0.87%).
| Demographics | Rating | Rank | Hearing Disability |
| Immigrants | Scotland | 0.8 /100 | #245 | Tragic 3.3% |
| Immigrants | England | 0.7 /100 | #246 | Tragic 3.3% |
| Lithuanians | 0.6 /100 | #247 | Tragic 3.4% |
| Austrians | 0.6 /100 | #248 | Tragic 3.4% |
| Italians | 0.4 /100 | #249 | Tragic 3.4% |
| Yuman | 0.4 /100 | #250 | Tragic 3.4% |
| Hungarians | 0.4 /100 | #251 | Tragic 3.4% |
| Croatians | 0.4 /100 | #252 | Tragic 3.4% |
| Carpatho Rusyns | 0.3 /100 | #253 | Tragic 3.4% |
| Slavs | 0.2 /100 | #254 | Tragic 3.4% |
| Poles | 0.2 /100 | #255 | Tragic 3.4% |
| Hmong | 0.2 /100 | #256 | Tragic 3.4% |
| Yaqui | 0.2 /100 | #257 | Tragic 3.4% |
| Northern Europeans | 0.2 /100 | #258 | Tragic 3.4% |
| Slovenes | 0.1 /100 | #259 | Tragic 3.5% |
Demographics Similar to Immigrants from Uruguay by Hearing Disability
In terms of hearing disability, the demographic groups most similar to Immigrants from Uruguay are Immigrants from Armenia (2.7%, a difference of 0.020%), Immigrants from Asia (2.7%, a difference of 0.030%), Immigrants from Cuba (2.7%, a difference of 0.030%), Colombian (2.7%, a difference of 0.21%), and Mongolian (2.7%, a difference of 0.23%).
| Demographics | Rating | Rank | Hearing Disability |
| Immigrants | Korea | 97.5 /100 | #74 | Exceptional 2.7% |
| Immigrants | Saudi Arabia | 97.5 /100 | #75 | Exceptional 2.7% |
| Asians | 97.5 /100 | #76 | Exceptional 2.7% |
| Immigrants | Malaysia | 97.5 /100 | #77 | Exceptional 2.7% |
| Mongolians | 97.4 /100 | #78 | Exceptional 2.7% |
| Colombians | 97.4 /100 | #79 | Exceptional 2.7% |
| Immigrants | Asia | 97.2 /100 | #80 | Exceptional 2.7% |
| Immigrants | Uruguay | 97.2 /100 | #81 | Exceptional 2.7% |
| Immigrants | Armenia | 97.2 /100 | #82 | Exceptional 2.7% |
| Immigrants | Cuba | 97.2 /100 | #83 | Exceptional 2.7% |
| Immigrants | Argentina | 97.0 /100 | #84 | Exceptional 2.8% |
| Immigrants | Northern Africa | 96.9 /100 | #85 | Exceptional 2.8% |
| Immigrants | Iran | 96.8 /100 | #86 | Exceptional 2.8% |
| Somalis | 96.7 /100 | #87 | Exceptional 2.8% |
| Immigrants | Turkey | 96.7 /100 | #88 | Exceptional 2.8% |