Creek vs Yugoslavian Male Disability
COMPARE
Creek
Yugoslavian
Male Disability
Male Disability Comparison
Creek
Yugoslavians
15.5%
MALE DISABILITY
0.0/ 100
METRIC RATING
343rd/ 347
METRIC RANK
11.9%
MALE DISABILITY
1.2/ 100
METRIC RATING
238th/ 347
METRIC RANK
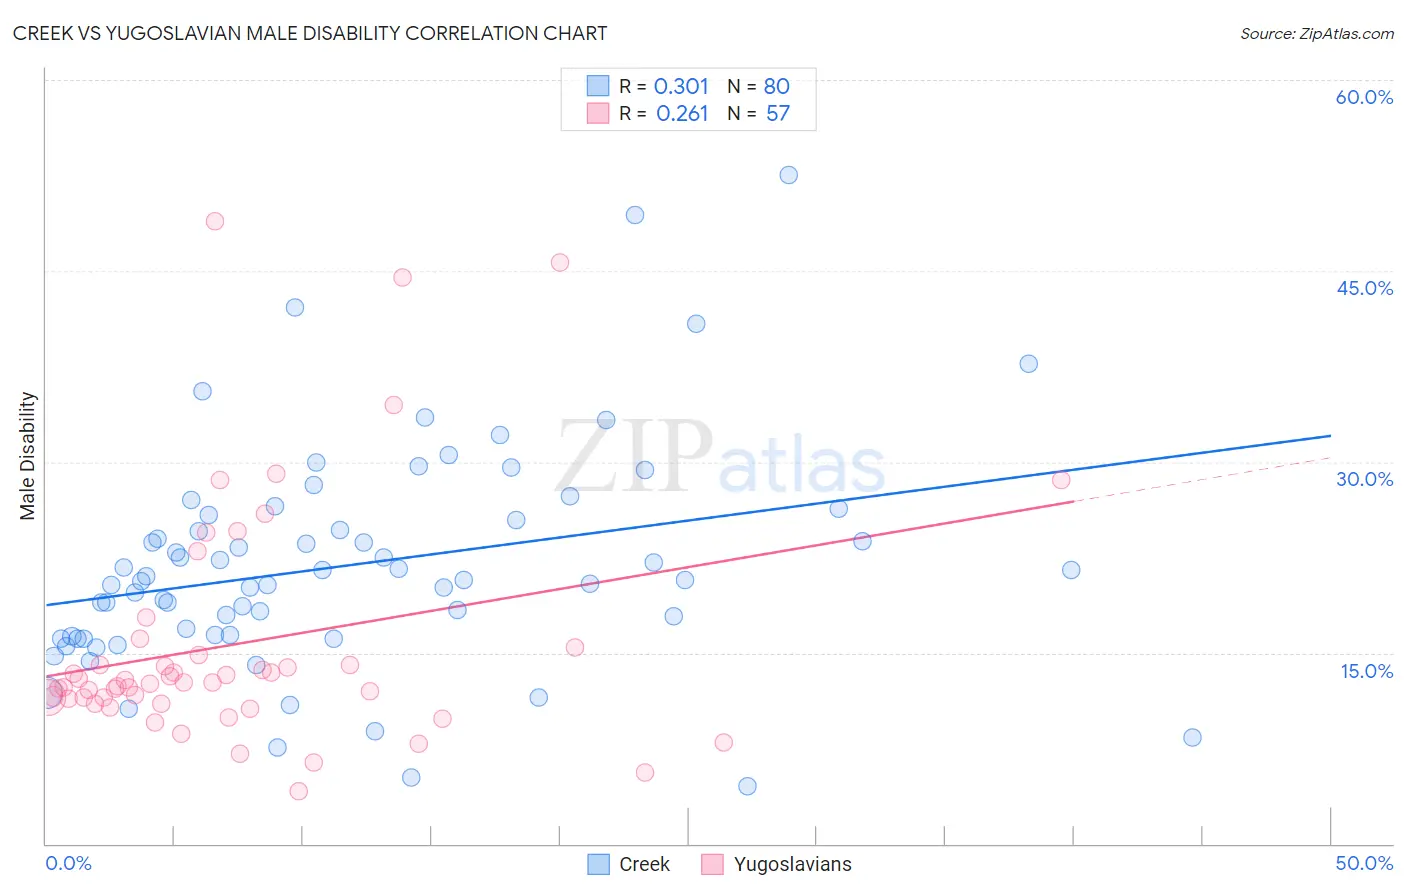
Creek vs Yugoslavian Male Disability Correlation Chart
The statistical analysis conducted on geographies consisting of 178,460,797 people shows a mild positive correlation between the proportion of Creek and percentage of males with a disability in the United States with a correlation coefficient (R) of 0.301 and weighted average of 15.5%. Similarly, the statistical analysis conducted on geographies consisting of 285,684,891 people shows a weak positive correlation between the proportion of Yugoslavians and percentage of males with a disability in the United States with a correlation coefficient (R) of 0.261 and weighted average of 11.9%, a difference of 30.5%.
Male Disability Correlation Summary
| Measurement | Creek | Yugoslavian |
| Minimum | 4.5% | 4.2% |
| Maximum | 52.5% | 48.9% |
| Range | 48.1% | 44.8% |
| Mean | 21.9% | 15.7% |
| Median | 20.7% | 12.6% |
| Interquartile 25% (IQ1) | 16.3% | 11.2% |
| Interquartile 75% (IQ3) | 25.6% | 15.1% |
| Interquartile Range (IQR) | 9.3% | 3.9% |
| Standard Deviation (Sample) | 8.7% | 9.5% |
| Standard Deviation (Population) | 8.7% | 9.4% |
Similar Demographics by Male Disability
Demographics Similar to Creek by Male Disability
In terms of male disability, the demographic groups most similar to Creek are Puerto Rican (15.6%, a difference of 0.13%), Tsimshian (15.6%, a difference of 0.45%), Kiowa (15.4%, a difference of 0.66%), Choctaw (15.4%, a difference of 0.85%), and Lumbee (15.2%, a difference of 2.0%).
| Demographics | Rating | Rank | Male Disability |
| Yuman | 0.0 /100 | #333 | Tragic 14.7% |
| Cherokee | 0.0 /100 | #334 | Tragic 14.8% |
| Dutch West Indians | 0.0 /100 | #335 | Tragic 14.8% |
| Alaskan Athabascans | 0.0 /100 | #336 | Tragic 14.9% |
| Menominee | 0.0 /100 | #337 | Tragic 15.0% |
| Pueblo | 0.0 /100 | #338 | Tragic 15.0% |
| Chickasaw | 0.0 /100 | #339 | Tragic 15.1% |
| Lumbee | 0.0 /100 | #340 | Tragic 15.2% |
| Choctaw | 0.0 /100 | #341 | Tragic 15.4% |
| Kiowa | 0.0 /100 | #342 | Tragic 15.4% |
| Creek | 0.0 /100 | #343 | Tragic 15.5% |
| Puerto Ricans | 0.0 /100 | #344 | Tragic 15.6% |
| Tsimshian | 0.0 /100 | #345 | Tragic 15.6% |
| Colville | 0.0 /100 | #346 | Tragic 16.5% |
| Houma | 0.0 /100 | #347 | Tragic 17.4% |
Demographics Similar to Yugoslavians by Male Disability
In terms of male disability, the demographic groups most similar to Yugoslavians are Italian (11.9%, a difference of 0.050%), Carpatho Rusyn (11.9%, a difference of 0.10%), Czech (11.9%, a difference of 0.10%), U.S. Virgin Islander (11.9%, a difference of 0.11%), and Bahamian (11.9%, a difference of 0.14%).
| Demographics | Rating | Rank | Male Disability |
| Dominicans | 1.8 /100 | #231 | Tragic 11.8% |
| Malaysians | 1.8 /100 | #232 | Tragic 11.8% |
| Mexicans | 1.7 /100 | #233 | Tragic 11.8% |
| Immigrants | Canada | 1.6 /100 | #234 | Tragic 11.9% |
| Immigrants | North America | 1.5 /100 | #235 | Tragic 11.9% |
| U.S. Virgin Islanders | 1.3 /100 | #236 | Tragic 11.9% |
| Carpatho Rusyns | 1.3 /100 | #237 | Tragic 11.9% |
| Yugoslavians | 1.2 /100 | #238 | Tragic 11.9% |
| Italians | 1.2 /100 | #239 | Tragic 11.9% |
| Czechs | 1.1 /100 | #240 | Tragic 11.9% |
| Bahamians | 1.1 /100 | #241 | Tragic 11.9% |
| Northern Europeans | 1.1 /100 | #242 | Tragic 11.9% |
| Samoans | 1.1 /100 | #243 | Tragic 11.9% |
| Immigrants | Laos | 1.0 /100 | #244 | Tragic 11.9% |
| Immigrants | Liberia | 1.0 /100 | #245 | Tragic 11.9% |