Cree vs Filipino Ambulatory Disability
COMPARE
Cree
Filipino
Ambulatory Disability
Ambulatory Disability Comparison
Cree
Filipinos
7.1%
AMBULATORY DISABILITY
0.0/ 100
METRIC RATING
311th/ 347
METRIC RANK
4.9%
AMBULATORY DISABILITY
100.0/ 100
METRIC RATING
2nd/ 347
METRIC RANK
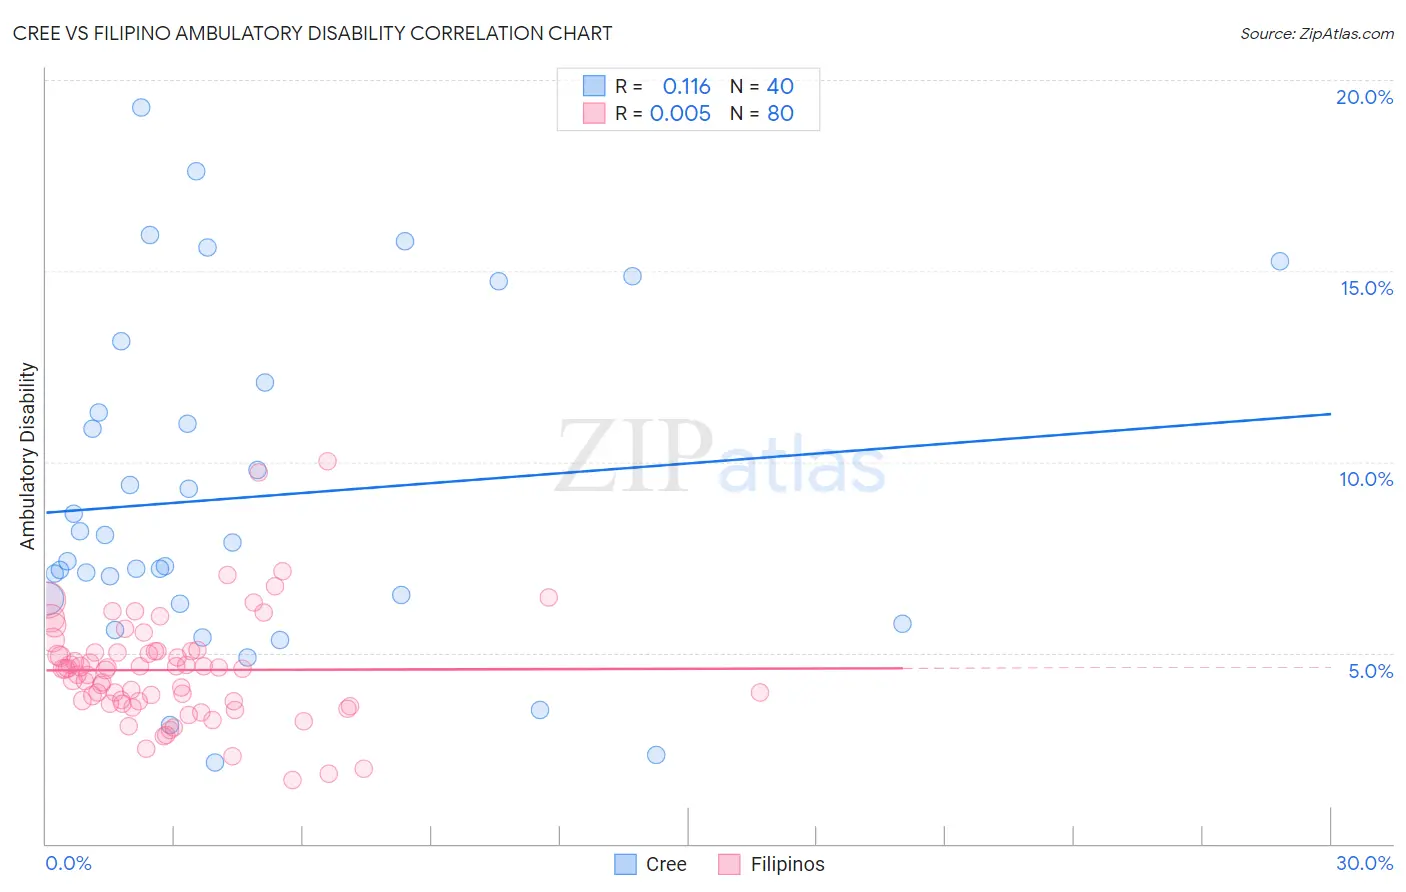
Cree vs Filipino Ambulatory Disability Correlation Chart
The statistical analysis conducted on geographies consisting of 76,208,414 people shows a poor positive correlation between the proportion of Cree and percentage of population with ambulatory disability in the United States with a correlation coefficient (R) of 0.116 and weighted average of 7.1%. Similarly, the statistical analysis conducted on geographies consisting of 254,292,295 people shows no correlation between the proportion of Filipinos and percentage of population with ambulatory disability in the United States with a correlation coefficient (R) of 0.005 and weighted average of 4.9%, a difference of 46.0%.
Ambulatory Disability Correlation Summary
| Measurement | Cree | Filipino |
| Minimum | 2.1% | 1.7% |
| Maximum | 19.3% | 10.0% |
| Range | 17.2% | 8.3% |
| Mean | 9.1% | 4.5% |
| Median | 7.7% | 4.6% |
| Interquartile 25% (IQ1) | 6.4% | 3.7% |
| Interquartile 75% (IQ3) | 11.7% | 5.0% |
| Interquartile Range (IQR) | 5.3% | 1.3% |
| Standard Deviation (Sample) | 4.3% | 1.4% |
| Standard Deviation (Population) | 4.3% | 1.4% |
Similar Demographics by Ambulatory Disability
Demographics Similar to Cree by Ambulatory Disability
In terms of ambulatory disability, the demographic groups most similar to Cree are Arapaho (7.1%, a difference of 0.010%), Delaware (7.1%, a difference of 0.22%), Immigrants from the Azores (7.1%, a difference of 0.29%), Immigrants from Yemen (7.1%, a difference of 0.35%), and Blackfeet (7.1%, a difference of 0.38%).
| Demographics | Rating | Rank | Ambulatory Disability |
| Immigrants | Cabo Verde | 0.0 /100 | #304 | Tragic 7.0% |
| Immigrants | Micronesia | 0.0 /100 | #305 | Tragic 7.0% |
| Iroquois | 0.0 /100 | #306 | Tragic 7.1% |
| Spanish Americans | 0.0 /100 | #307 | Tragic 7.1% |
| Chippewa | 0.0 /100 | #308 | Tragic 7.1% |
| Immigrants | Azores | 0.0 /100 | #309 | Tragic 7.1% |
| Arapaho | 0.0 /100 | #310 | Tragic 7.1% |
| Cree | 0.0 /100 | #311 | Tragic 7.1% |
| Delaware | 0.0 /100 | #312 | Tragic 7.1% |
| Immigrants | Yemen | 0.0 /100 | #313 | Tragic 7.1% |
| Blackfeet | 0.0 /100 | #314 | Tragic 7.1% |
| Shoshone | 0.0 /100 | #315 | Tragic 7.1% |
| Immigrants | Dominican Republic | 0.0 /100 | #316 | Tragic 7.1% |
| Central American Indians | 0.0 /100 | #317 | Tragic 7.2% |
| Ottawa | 0.0 /100 | #318 | Tragic 7.2% |
Demographics Similar to Filipinos by Ambulatory Disability
In terms of ambulatory disability, the demographic groups most similar to Filipinos are Thai (4.9%, a difference of 1.2%), Immigrants from Taiwan (4.9%, a difference of 1.4%), Immigrants from India (4.8%, a difference of 2.0%), Immigrants from Singapore (5.0%, a difference of 2.8%), and Immigrants from Bolivia (5.0%, a difference of 3.5%).
| Demographics | Rating | Rank | Ambulatory Disability |
| Immigrants | India | 100.0 /100 | #1 | Exceptional 4.8% |
| Filipinos | 100.0 /100 | #2 | Exceptional 4.9% |
| Thais | 100.0 /100 | #3 | Exceptional 4.9% |
| Immigrants | Taiwan | 100.0 /100 | #4 | Exceptional 4.9% |
| Immigrants | Singapore | 100.0 /100 | #5 | Exceptional 5.0% |
| Immigrants | Bolivia | 100.0 /100 | #6 | Exceptional 5.0% |
| Bolivians | 100.0 /100 | #7 | Exceptional 5.1% |
| Immigrants | South Central Asia | 100.0 /100 | #8 | Exceptional 5.1% |
| Iranians | 100.0 /100 | #9 | Exceptional 5.1% |
| Yup'ik | 100.0 /100 | #10 | Exceptional 5.2% |
| Immigrants | Korea | 100.0 /100 | #11 | Exceptional 5.2% |
| Okinawans | 100.0 /100 | #12 | Exceptional 5.3% |
| Burmese | 100.0 /100 | #13 | Exceptional 5.3% |
| Immigrants | Eastern Asia | 100.0 /100 | #14 | Exceptional 5.3% |
| Immigrants | China | 100.0 /100 | #15 | Exceptional 5.3% |