Cree vs Haitian Disability Age Under 5
COMPARE
Cree
Haitian
Disability Age Under 5
Disability Age Under 5 Comparison
Cree
Haitians
1.4%
DISABILITY AGE UNDER 5
0.1/ 100
METRIC RATING
267th/ 347
METRIC RANK
1.3%
DISABILITY AGE UNDER 5
39.9/ 100
METRIC RATING
188th/ 347
METRIC RANK
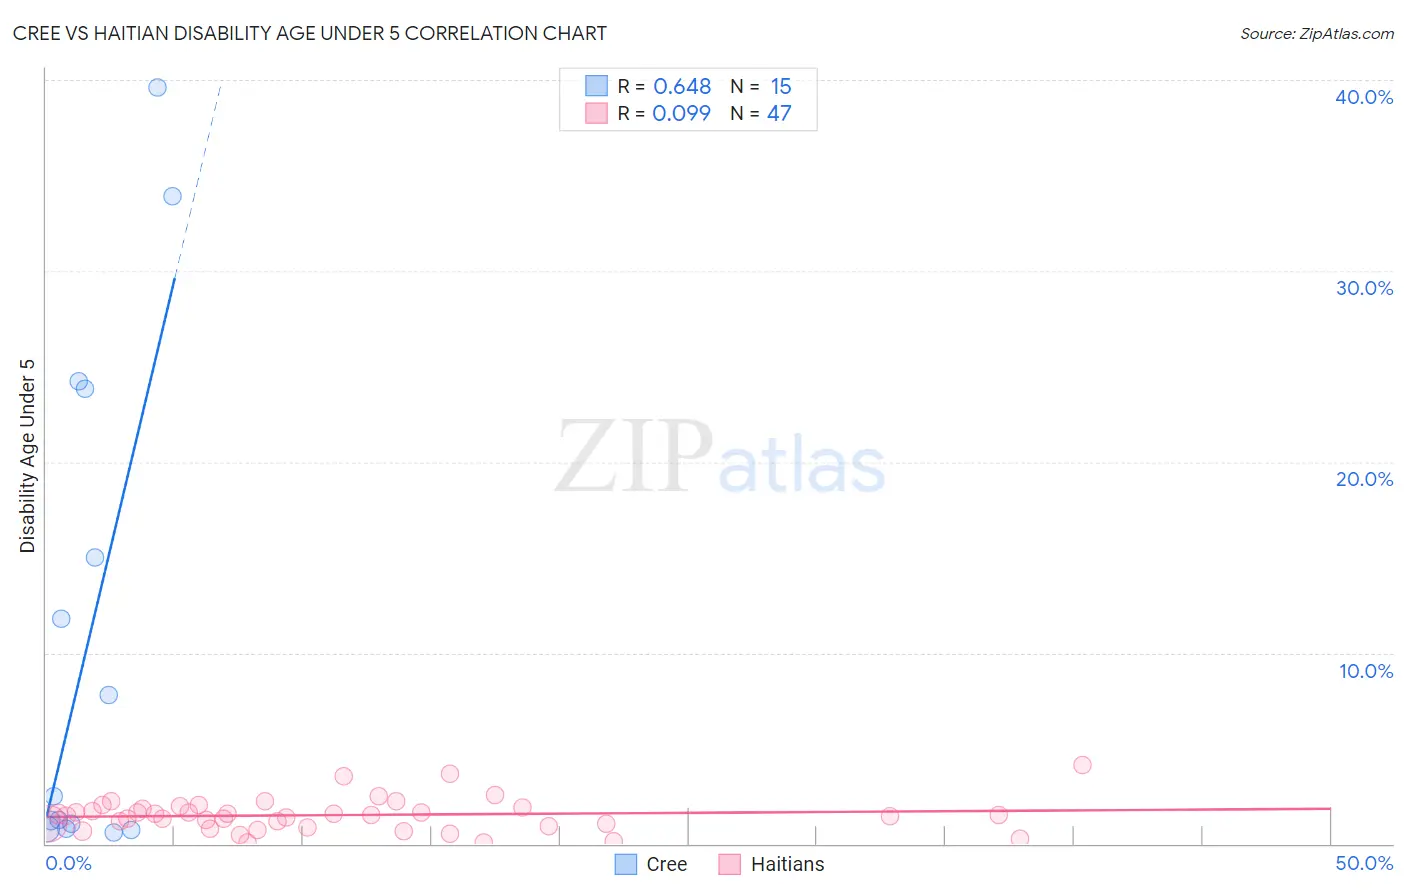
Cree vs Haitian Disability Age Under 5 Correlation Chart
The statistical analysis conducted on geographies consisting of 59,931,307 people shows a significant positive correlation between the proportion of Cree and percentage of population with a disability under the age of 5 in the United States with a correlation coefficient (R) of 0.648 and weighted average of 1.4%. Similarly, the statistical analysis conducted on geographies consisting of 169,174,150 people shows a slight positive correlation between the proportion of Haitians and percentage of population with a disability under the age of 5 in the United States with a correlation coefficient (R) of 0.099 and weighted average of 1.3%, a difference of 14.3%.
Disability Age Under 5 Correlation Summary
| Measurement | Cree | Haitian |
| Minimum | 0.57% | 0.082% |
| Maximum | 39.6% | 4.1% |
| Range | 39.0% | 4.0% |
| Mean | 11.0% | 1.5% |
| Median | 2.5% | 1.5% |
| Interquartile 25% (IQ1) | 0.80% | 0.90% |
| Interquartile 75% (IQ3) | 23.8% | 1.9% |
| Interquartile Range (IQR) | 23.0% | 1.0% |
| Standard Deviation (Sample) | 13.3% | 0.86% |
| Standard Deviation (Population) | 12.9% | 0.85% |
Similar Demographics by Disability Age Under 5
Demographics Similar to Cree by Disability Age Under 5
In terms of disability age under 5, the demographic groups most similar to Cree are Immigrants from Germany (1.4%, a difference of 0.52%), Carpatho Rusyn (1.4%, a difference of 0.55%), Belgian (1.4%, a difference of 0.58%), Yugoslavian (1.4%, a difference of 0.60%), and Spanish (1.4%, a difference of 0.75%).
| Demographics | Rating | Rank | Disability Age Under 5 |
| Slavs | 0.3 /100 | #260 | Tragic 1.4% |
| Immigrants | Netherlands | 0.2 /100 | #261 | Tragic 1.4% |
| Immigrants | Dominica | 0.2 /100 | #262 | Tragic 1.4% |
| Spanish | 0.2 /100 | #263 | Tragic 1.4% |
| Yugoslavians | 0.1 /100 | #264 | Tragic 1.4% |
| Carpatho Rusyns | 0.1 /100 | #265 | Tragic 1.4% |
| Immigrants | Germany | 0.1 /100 | #266 | Tragic 1.4% |
| Cree | 0.1 /100 | #267 | Tragic 1.4% |
| Belgians | 0.1 /100 | #268 | Tragic 1.4% |
| Austrians | 0.1 /100 | #269 | Tragic 1.4% |
| Immigrants | North America | 0.1 /100 | #270 | Tragic 1.4% |
| Immigrants | Canada | 0.1 /100 | #271 | Tragic 1.4% |
| Blacks/African Americans | 0.1 /100 | #272 | Tragic 1.4% |
| Alaskan Athabascans | 0.1 /100 | #273 | Tragic 1.5% |
| Iroquois | 0.0 /100 | #274 | Tragic 1.5% |
Demographics Similar to Haitians by Disability Age Under 5
In terms of disability age under 5, the demographic groups most similar to Haitians are Immigrants from Haiti (1.3%, a difference of 0.020%), Peruvian (1.3%, a difference of 0.22%), Cuban (1.2%, a difference of 0.23%), Immigrants from Western Africa (1.2%, a difference of 0.24%), and Palestinian (1.2%, a difference of 0.29%).
| Demographics | Rating | Rank | Disability Age Under 5 |
| Macedonians | 43.7 /100 | #181 | Average 1.2% |
| Immigrants | Peru | 43.7 /100 | #181 | Average 1.2% |
| Immigrants | Saudi Arabia | 43.3 /100 | #183 | Average 1.2% |
| Palestinians | 43.0 /100 | #184 | Average 1.2% |
| Immigrants | Western Africa | 42.5 /100 | #185 | Average 1.2% |
| Cubans | 42.5 /100 | #186 | Average 1.2% |
| Immigrants | Haiti | 40.2 /100 | #187 | Average 1.3% |
| Haitians | 39.9 /100 | #188 | Fair 1.3% |
| Peruvians | 37.6 /100 | #189 | Fair 1.3% |
| Immigrants | Laos | 36.6 /100 | #190 | Fair 1.3% |
| Mexican American Indians | 36.6 /100 | #191 | Fair 1.3% |
| Immigrants | Bosnia and Herzegovina | 36.5 /100 | #192 | Fair 1.3% |
| Immigrants | Sierra Leone | 36.5 /100 | #193 | Fair 1.3% |
| Immigrants | North Macedonia | 34.7 /100 | #194 | Fair 1.3% |
| U.S. Virgin Islanders | 34.4 /100 | #195 | Fair 1.3% |