Cree vs Immigrants Disability Age Under 5
COMPARE
Cree
Immigrants
Disability Age Under 5
Disability Age Under 5 Comparison
Cree
Immigrants
1.4%
DISABILITY AGE UNDER 5
0.1/ 100
METRIC RATING
267th/ 347
METRIC RANK
1.2%
DISABILITY AGE UNDER 5
88.0/ 100
METRIC RATING
129th/ 347
METRIC RANK
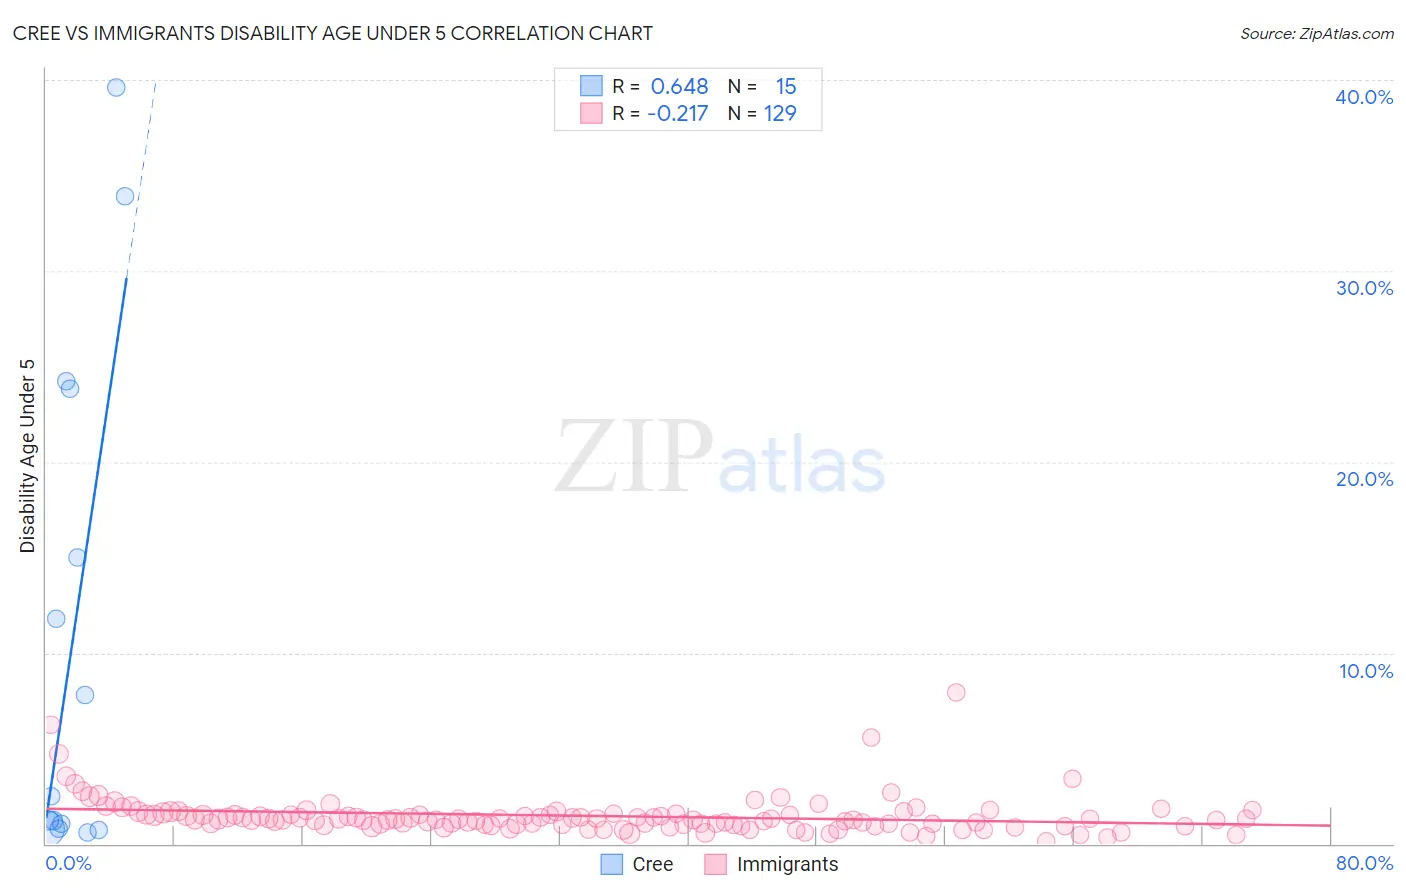
Cree vs Immigrants Disability Age Under 5 Correlation Chart
The statistical analysis conducted on geographies consisting of 59,931,307 people shows a significant positive correlation between the proportion of Cree and percentage of population with a disability under the age of 5 in the United States with a correlation coefficient (R) of 0.648 and weighted average of 1.4%. Similarly, the statistical analysis conducted on geographies consisting of 262,190,696 people shows a weak negative correlation between the proportion of Immigrants and percentage of population with a disability under the age of 5 in the United States with a correlation coefficient (R) of -0.217 and weighted average of 1.2%, a difference of 20.8%.
Disability Age Under 5 Correlation Summary
| Measurement | Cree | Immigrants |
| Minimum | 0.57% | 0.14% |
| Maximum | 39.6% | 7.9% |
| Range | 39.0% | 7.8% |
| Mean | 11.0% | 1.5% |
| Median | 2.5% | 1.3% |
| Interquartile 25% (IQ1) | 0.80% | 1.0% |
| Interquartile 75% (IQ3) | 23.8% | 1.5% |
| Interquartile Range (IQR) | 23.0% | 0.54% |
| Standard Deviation (Sample) | 13.3% | 1.0% |
| Standard Deviation (Population) | 12.9% | 1.0% |
Similar Demographics by Disability Age Under 5
Demographics Similar to Cree by Disability Age Under 5
In terms of disability age under 5, the demographic groups most similar to Cree are Immigrants from Germany (1.4%, a difference of 0.52%), Carpatho Rusyn (1.4%, a difference of 0.55%), Belgian (1.4%, a difference of 0.58%), Yugoslavian (1.4%, a difference of 0.60%), and Spanish (1.4%, a difference of 0.75%).
| Demographics | Rating | Rank | Disability Age Under 5 |
| Slavs | 0.3 /100 | #260 | Tragic 1.4% |
| Immigrants | Netherlands | 0.2 /100 | #261 | Tragic 1.4% |
| Immigrants | Dominica | 0.2 /100 | #262 | Tragic 1.4% |
| Spanish | 0.2 /100 | #263 | Tragic 1.4% |
| Yugoslavians | 0.1 /100 | #264 | Tragic 1.4% |
| Carpatho Rusyns | 0.1 /100 | #265 | Tragic 1.4% |
| Immigrants | Germany | 0.1 /100 | #266 | Tragic 1.4% |
| Cree | 0.1 /100 | #267 | Tragic 1.4% |
| Belgians | 0.1 /100 | #268 | Tragic 1.4% |
| Austrians | 0.1 /100 | #269 | Tragic 1.4% |
| Immigrants | North America | 0.1 /100 | #270 | Tragic 1.4% |
| Immigrants | Canada | 0.1 /100 | #271 | Tragic 1.4% |
| Blacks/African Americans | 0.1 /100 | #272 | Tragic 1.4% |
| Alaskan Athabascans | 0.1 /100 | #273 | Tragic 1.5% |
| Iroquois | 0.0 /100 | #274 | Tragic 1.5% |
Demographics Similar to Immigrants by Disability Age Under 5
In terms of disability age under 5, the demographic groups most similar to Immigrants are Korean (1.2%, a difference of 0.080%), Immigrants from Romania (1.2%, a difference of 0.090%), Immigrants from France (1.2%, a difference of 0.090%), Immigrants from Serbia (1.2%, a difference of 0.090%), and Immigrants from Eastern Europe (1.2%, a difference of 0.16%).
| Demographics | Rating | Rank | Disability Age Under 5 |
| Aleuts | 90.7 /100 | #122 | Exceptional 1.2% |
| Zimbabweans | 90.6 /100 | #123 | Exceptional 1.2% |
| Immigrants | Cambodia | 90.5 /100 | #124 | Exceptional 1.2% |
| Japanese | 90.3 /100 | #125 | Exceptional 1.2% |
| Central Americans | 89.7 /100 | #126 | Excellent 1.2% |
| Immigrants | Romania | 88.4 /100 | #127 | Excellent 1.2% |
| Immigrants | France | 88.4 /100 | #128 | Excellent 1.2% |
| Immigrants | Immigrants | 88.0 /100 | #129 | Excellent 1.2% |
| Koreans | 87.7 /100 | #130 | Excellent 1.2% |
| Immigrants | Serbia | 87.6 /100 | #131 | Excellent 1.2% |
| Immigrants | Eastern Europe | 87.3 /100 | #132 | Excellent 1.2% |
| Immigrants | Spain | 86.5 /100 | #133 | Excellent 1.2% |
| Argentineans | 85.7 /100 | #134 | Excellent 1.2% |
| Fijians | 84.7 /100 | #135 | Excellent 1.2% |
| Moroccans | 83.6 /100 | #136 | Excellent 1.2% |