Costa Rican vs Spaniard Female Disability
COMPARE
Costa Rican
Spaniard
Female Disability
Female Disability Comparison
Costa Ricans
Spaniards
11.7%
FEMALE DISABILITY
98.1/ 100
METRIC RATING
111th/ 347
METRIC RANK
12.8%
FEMALE DISABILITY
0.7/ 100
METRIC RATING
263rd/ 347
METRIC RANK
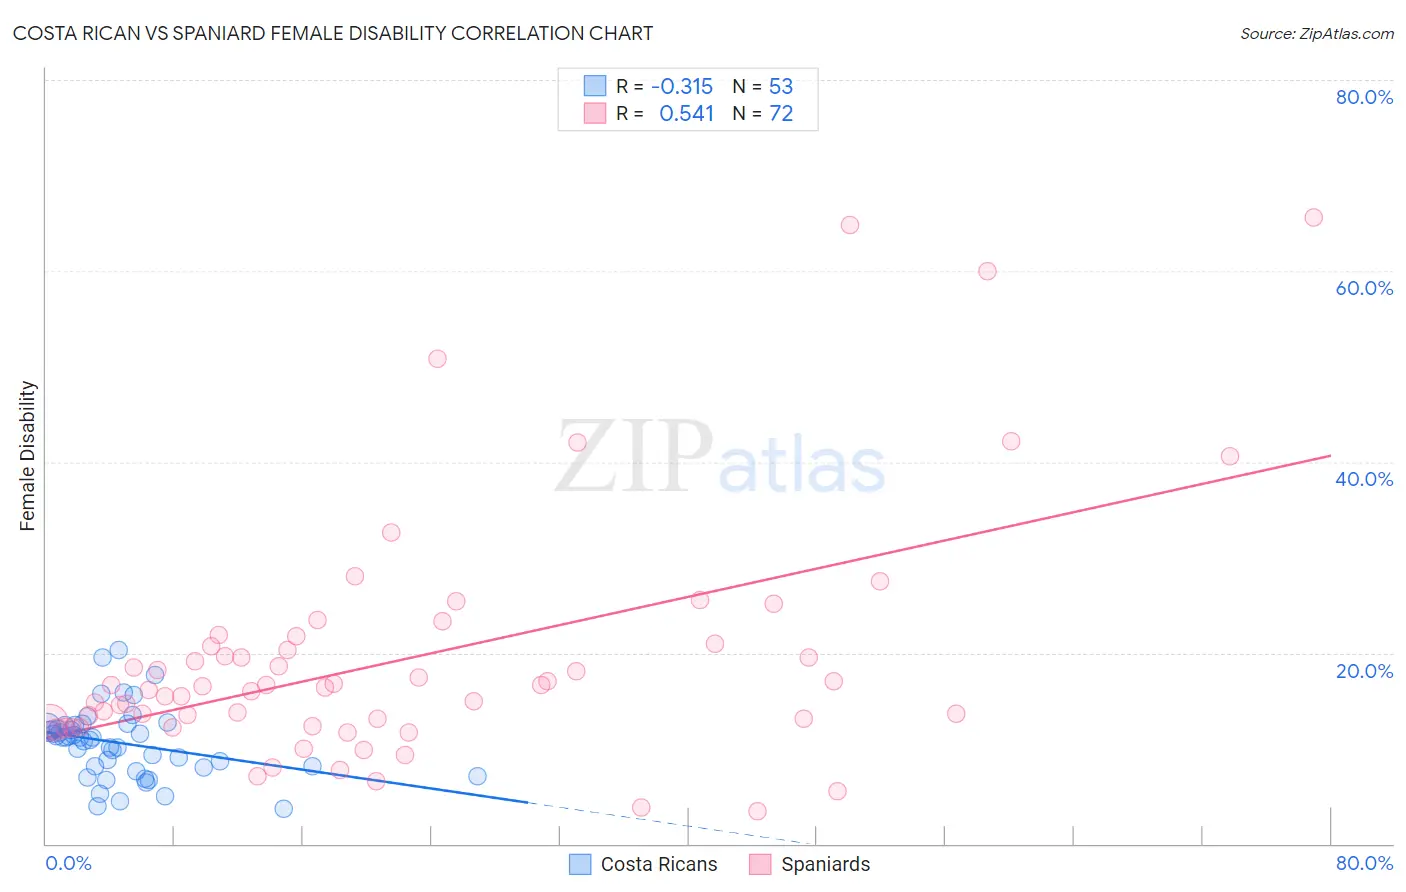
Costa Rican vs Spaniard Female Disability Correlation Chart
The statistical analysis conducted on geographies consisting of 253,556,053 people shows a mild negative correlation between the proportion of Costa Ricans and percentage of females with a disability in the United States with a correlation coefficient (R) of -0.315 and weighted average of 11.7%. Similarly, the statistical analysis conducted on geographies consisting of 443,418,073 people shows a substantial positive correlation between the proportion of Spaniards and percentage of females with a disability in the United States with a correlation coefficient (R) of 0.541 and weighted average of 12.8%, a difference of 8.7%.
Female Disability Correlation Summary
| Measurement | Costa Rican | Spaniard |
| Minimum | 3.6% | 3.4% |
| Maximum | 20.3% | 65.6% |
| Range | 16.7% | 62.2% |
| Mean | 10.6% | 19.4% |
| Median | 11.1% | 16.4% |
| Interquartile 25% (IQ1) | 8.1% | 12.5% |
| Interquartile 75% (IQ3) | 12.3% | 20.8% |
| Interquartile Range (IQR) | 4.2% | 8.3% |
| Standard Deviation (Sample) | 3.6% | 12.6% |
| Standard Deviation (Population) | 3.6% | 12.5% |
Similar Demographics by Female Disability
Demographics Similar to Costa Ricans by Female Disability
In terms of female disability, the demographic groups most similar to Costa Ricans are Immigrants (11.7%, a difference of 0.020%), Soviet Union (11.7%, a difference of 0.020%), New Zealander (11.7%, a difference of 0.050%), Latvian (11.7%, a difference of 0.070%), and Immigrants from Greece (11.7%, a difference of 0.090%).
| Demographics | Rating | Rank | Female Disability |
| Immigrants | Western Asia | 98.3 /100 | #104 | Exceptional 11.7% |
| Australians | 98.3 /100 | #105 | Exceptional 11.7% |
| Immigrants | Greece | 98.2 /100 | #106 | Exceptional 11.7% |
| Latvians | 98.2 /100 | #107 | Exceptional 11.7% |
| New Zealanders | 98.1 /100 | #108 | Exceptional 11.7% |
| Immigrants | Immigrants | 98.1 /100 | #109 | Exceptional 11.7% |
| Soviet Union | 98.1 /100 | #110 | Exceptional 11.7% |
| Costa Ricans | 98.1 /100 | #111 | Exceptional 11.7% |
| Immigrants | Bangladesh | 97.8 /100 | #112 | Exceptional 11.8% |
| Immigrants | Belarus | 97.8 /100 | #113 | Exceptional 11.8% |
| South Africans | 97.7 /100 | #114 | Exceptional 11.8% |
| Brazilians | 97.7 /100 | #115 | Exceptional 11.8% |
| Immigrants | Morocco | 97.6 /100 | #116 | Exceptional 11.8% |
| Immigrants | Eastern Europe | 97.2 /100 | #117 | Exceptional 11.8% |
| Immigrants | Nigeria | 97.2 /100 | #118 | Exceptional 11.8% |
Demographics Similar to Spaniards by Female Disability
In terms of female disability, the demographic groups most similar to Spaniards are Alaska Native (12.8%, a difference of 0.12%), Czechoslovakian (12.7%, a difference of 0.23%), Bermudan (12.7%, a difference of 0.30%), West Indian (12.8%, a difference of 0.31%), and Subsaharan African (12.7%, a difference of 0.34%).
| Demographics | Rating | Rank | Female Disability |
| British West Indians | 1.2 /100 | #256 | Tragic 12.7% |
| Liberians | 1.1 /100 | #257 | Tragic 12.7% |
| Aleuts | 1.1 /100 | #258 | Tragic 12.7% |
| Immigrants | Armenia | 1.0 /100 | #259 | Tragic 12.7% |
| Sub-Saharan Africans | 1.0 /100 | #260 | Tragic 12.7% |
| Bermudans | 1.0 /100 | #261 | Tragic 12.7% |
| Czechoslovakians | 0.9 /100 | #262 | Tragic 12.7% |
| Spaniards | 0.7 /100 | #263 | Tragic 12.8% |
| Alaska Natives | 0.6 /100 | #264 | Tragic 12.8% |
| West Indians | 0.5 /100 | #265 | Tragic 12.8% |
| Finns | 0.4 /100 | #266 | Tragic 12.8% |
| Senegalese | 0.4 /100 | #267 | Tragic 12.8% |
| Immigrants | Laos | 0.4 /100 | #268 | Tragic 12.8% |
| Indonesians | 0.4 /100 | #269 | Tragic 12.8% |
| Immigrants | Liberia | 0.3 /100 | #270 | Tragic 12.9% |