Costa Rican vs Immigrants from Central America Female Disability
COMPARE
Costa Rican
Immigrants from Central America
Female Disability
Female Disability Comparison
Costa Ricans
Immigrants from Central America
11.7%
FEMALE DISABILITY
98.1/ 100
METRIC RATING
111th/ 347
METRIC RANK
12.1%
FEMALE DISABILITY
67.7/ 100
METRIC RATING
159th/ 347
METRIC RANK
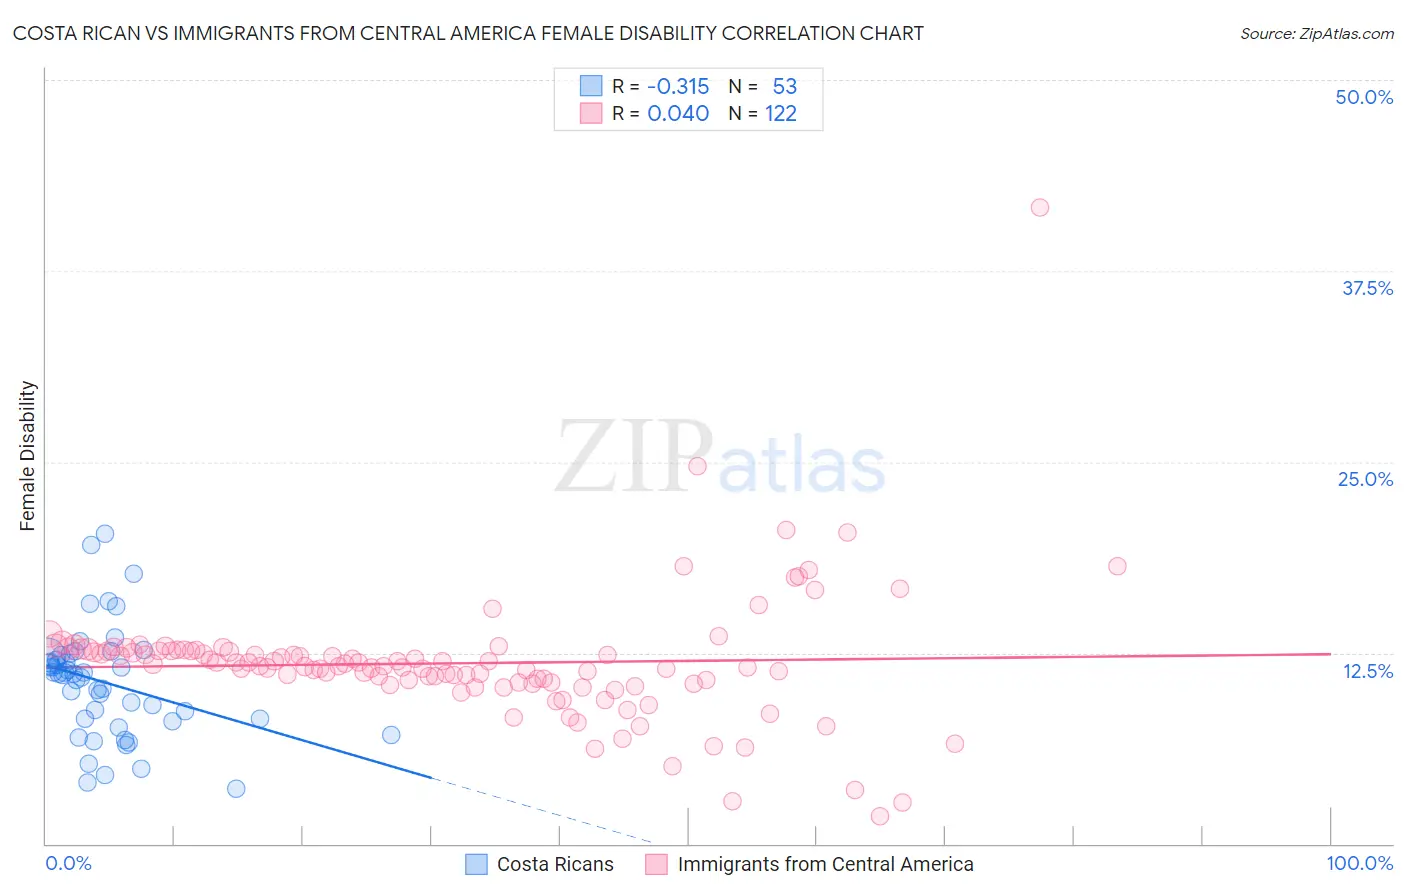
Costa Rican vs Immigrants from Central America Female Disability Correlation Chart
The statistical analysis conducted on geographies consisting of 253,556,053 people shows a mild negative correlation between the proportion of Costa Ricans and percentage of females with a disability in the United States with a correlation coefficient (R) of -0.315 and weighted average of 11.7%. Similarly, the statistical analysis conducted on geographies consisting of 536,290,679 people shows no correlation between the proportion of Immigrants from Central America and percentage of females with a disability in the United States with a correlation coefficient (R) of 0.040 and weighted average of 12.1%, a difference of 3.1%.
Female Disability Correlation Summary
| Measurement | Costa Rican | Immigrants from Central America |
| Minimum | 3.6% | 1.8% |
| Maximum | 20.3% | 41.7% |
| Range | 16.7% | 39.9% |
| Mean | 10.6% | 11.8% |
| Median | 11.1% | 11.7% |
| Interquartile 25% (IQ1) | 8.1% | 10.6% |
| Interquartile 75% (IQ3) | 12.3% | 12.6% |
| Interquartile Range (IQR) | 4.2% | 2.1% |
| Standard Deviation (Sample) | 3.6% | 4.2% |
| Standard Deviation (Population) | 3.6% | 4.2% |
Similar Demographics by Female Disability
Demographics Similar to Costa Ricans by Female Disability
In terms of female disability, the demographic groups most similar to Costa Ricans are Immigrants (11.7%, a difference of 0.020%), Soviet Union (11.7%, a difference of 0.020%), New Zealander (11.7%, a difference of 0.050%), Latvian (11.7%, a difference of 0.070%), and Immigrants from Greece (11.7%, a difference of 0.090%).
| Demographics | Rating | Rank | Female Disability |
| Immigrants | Western Asia | 98.3 /100 | #104 | Exceptional 11.7% |
| Australians | 98.3 /100 | #105 | Exceptional 11.7% |
| Immigrants | Greece | 98.2 /100 | #106 | Exceptional 11.7% |
| Latvians | 98.2 /100 | #107 | Exceptional 11.7% |
| New Zealanders | 98.1 /100 | #108 | Exceptional 11.7% |
| Immigrants | Immigrants | 98.1 /100 | #109 | Exceptional 11.7% |
| Soviet Union | 98.1 /100 | #110 | Exceptional 11.7% |
| Costa Ricans | 98.1 /100 | #111 | Exceptional 11.7% |
| Immigrants | Bangladesh | 97.8 /100 | #112 | Exceptional 11.8% |
| Immigrants | Belarus | 97.8 /100 | #113 | Exceptional 11.8% |
| South Africans | 97.7 /100 | #114 | Exceptional 11.8% |
| Brazilians | 97.7 /100 | #115 | Exceptional 11.8% |
| Immigrants | Morocco | 97.6 /100 | #116 | Exceptional 11.8% |
| Immigrants | Eastern Europe | 97.2 /100 | #117 | Exceptional 11.8% |
| Immigrants | Nigeria | 97.2 /100 | #118 | Exceptional 11.8% |
Demographics Similar to Immigrants from Central America by Female Disability
In terms of female disability, the demographic groups most similar to Immigrants from Central America are Immigrants from Guatemala (12.1%, a difference of 0.070%), Guyanese (12.1%, a difference of 0.13%), Immigrants from Ukraine (12.1%, a difference of 0.14%), Guatemalan (12.1%, a difference of 0.16%), and Czech (12.1%, a difference of 0.17%).
| Demographics | Rating | Rank | Female Disability |
| Immigrants | Scotland | 79.3 /100 | #152 | Good 12.0% |
| Sudanese | 79.1 /100 | #153 | Good 12.0% |
| Syrians | 76.9 /100 | #154 | Good 12.1% |
| Ghanaians | 76.6 /100 | #155 | Good 12.1% |
| Moroccans | 72.9 /100 | #156 | Good 12.1% |
| Danes | 72.5 /100 | #157 | Good 12.1% |
| Immigrants | Middle Africa | 72.4 /100 | #158 | Good 12.1% |
| Immigrants | Central America | 67.7 /100 | #159 | Good 12.1% |
| Immigrants | Guatemala | 66.0 /100 | #160 | Good 12.1% |
| Guyanese | 64.7 /100 | #161 | Good 12.1% |
| Immigrants | Ukraine | 64.3 /100 | #162 | Good 12.1% |
| Guatemalans | 63.8 /100 | #163 | Good 12.1% |
| Czechs | 63.6 /100 | #164 | Good 12.1% |
| Immigrants | Oceania | 61.8 /100 | #165 | Good 12.1% |
| Lithuanians | 59.5 /100 | #166 | Average 12.2% |