Immigrants from Haiti vs Spaniard Female Disability
COMPARE
Immigrants from Haiti
Spaniard
Female Disability
Female Disability Comparison
Immigrants from Haiti
Spaniards
12.2%
FEMALE DISABILITY
58.8/ 100
METRIC RATING
168th/ 347
METRIC RANK
12.8%
FEMALE DISABILITY
0.7/ 100
METRIC RATING
263rd/ 347
METRIC RANK
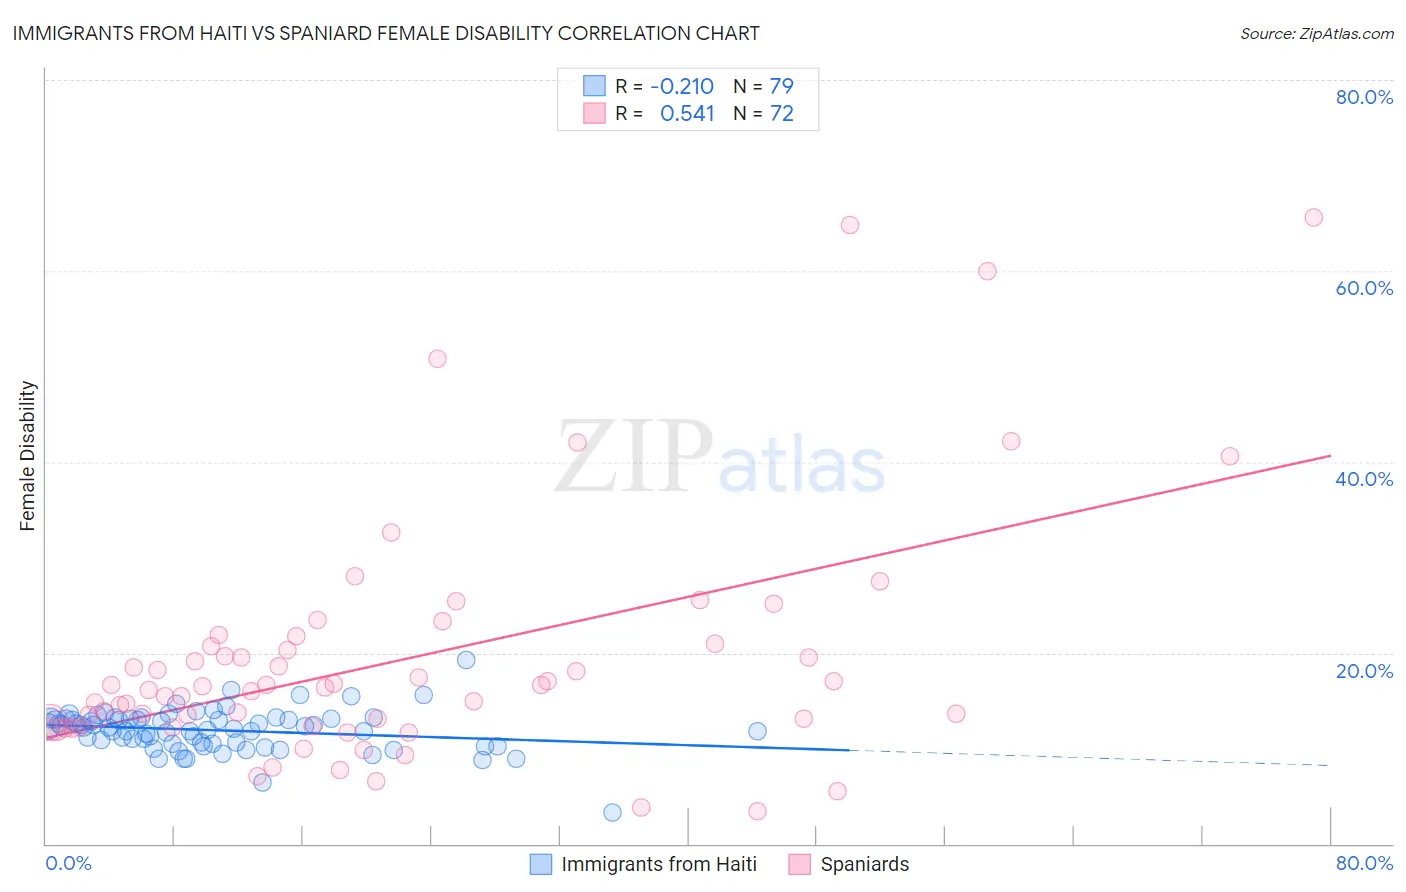
Immigrants from Haiti vs Spaniard Female Disability Correlation Chart
The statistical analysis conducted on geographies consisting of 225,238,794 people shows a weak negative correlation between the proportion of Immigrants from Haiti and percentage of females with a disability in the United States with a correlation coefficient (R) of -0.210 and weighted average of 12.2%. Similarly, the statistical analysis conducted on geographies consisting of 443,418,073 people shows a substantial positive correlation between the proportion of Spaniards and percentage of females with a disability in the United States with a correlation coefficient (R) of 0.541 and weighted average of 12.8%, a difference of 5.0%.
Female Disability Correlation Summary
| Measurement | Immigrants from Haiti | Spaniard |
| Minimum | 3.3% | 3.4% |
| Maximum | 19.2% | 65.6% |
| Range | 15.9% | 62.2% |
| Mean | 11.9% | 19.4% |
| Median | 12.1% | 16.4% |
| Interquartile 25% (IQ1) | 10.5% | 12.5% |
| Interquartile 75% (IQ3) | 13.1% | 20.8% |
| Interquartile Range (IQR) | 2.6% | 8.3% |
| Standard Deviation (Sample) | 2.2% | 12.6% |
| Standard Deviation (Population) | 2.2% | 12.5% |
Similar Demographics by Female Disability
Demographics Similar to Immigrants from Haiti by Female Disability
In terms of female disability, the demographic groups most similar to Immigrants from Haiti are Immigrants from Latin America (12.2%, a difference of 0.010%), Lithuanian (12.2%, a difference of 0.030%), Lebanese (12.2%, a difference of 0.030%), Maltese (12.2%, a difference of 0.070%), and Immigrants from Southern Europe (12.2%, a difference of 0.10%).
| Demographics | Rating | Rank | Female Disability |
| Guyanese | 64.7 /100 | #161 | Good 12.1% |
| Immigrants | Ukraine | 64.3 /100 | #162 | Good 12.1% |
| Guatemalans | 63.8 /100 | #163 | Good 12.1% |
| Czechs | 63.6 /100 | #164 | Good 12.1% |
| Immigrants | Oceania | 61.8 /100 | #165 | Good 12.1% |
| Lithuanians | 59.5 /100 | #166 | Average 12.2% |
| Immigrants | Latin America | 59.0 /100 | #167 | Average 12.2% |
| Immigrants | Haiti | 58.8 /100 | #168 | Average 12.2% |
| Lebanese | 58.1 /100 | #169 | Average 12.2% |
| Maltese | 57.0 /100 | #170 | Average 12.2% |
| Immigrants | Southern Europe | 56.3 /100 | #171 | Average 12.2% |
| Haitians | 51.9 /100 | #172 | Average 12.2% |
| Immigrants | Mexico | 50.8 /100 | #173 | Average 12.2% |
| Immigrants | England | 50.0 /100 | #174 | Average 12.2% |
| Immigrants | St. Vincent and the Grenadines | 49.7 /100 | #175 | Average 12.2% |
Demographics Similar to Spaniards by Female Disability
In terms of female disability, the demographic groups most similar to Spaniards are Alaska Native (12.8%, a difference of 0.12%), Czechoslovakian (12.7%, a difference of 0.23%), Bermudan (12.7%, a difference of 0.30%), West Indian (12.8%, a difference of 0.31%), and Subsaharan African (12.7%, a difference of 0.34%).
| Demographics | Rating | Rank | Female Disability |
| British West Indians | 1.2 /100 | #256 | Tragic 12.7% |
| Liberians | 1.1 /100 | #257 | Tragic 12.7% |
| Aleuts | 1.1 /100 | #258 | Tragic 12.7% |
| Immigrants | Armenia | 1.0 /100 | #259 | Tragic 12.7% |
| Sub-Saharan Africans | 1.0 /100 | #260 | Tragic 12.7% |
| Bermudans | 1.0 /100 | #261 | Tragic 12.7% |
| Czechoslovakians | 0.9 /100 | #262 | Tragic 12.7% |
| Spaniards | 0.7 /100 | #263 | Tragic 12.8% |
| Alaska Natives | 0.6 /100 | #264 | Tragic 12.8% |
| West Indians | 0.5 /100 | #265 | Tragic 12.8% |
| Finns | 0.4 /100 | #266 | Tragic 12.8% |
| Senegalese | 0.4 /100 | #267 | Tragic 12.8% |
| Immigrants | Laos | 0.4 /100 | #268 | Tragic 12.8% |
| Indonesians | 0.4 /100 | #269 | Tragic 12.8% |
| Immigrants | Liberia | 0.3 /100 | #270 | Tragic 12.9% |