Costa Rican vs Soviet Union Female Disability
COMPARE
Costa Rican
Soviet Union
Female Disability
Female Disability Comparison
Costa Ricans
Soviet Union
11.7%
FEMALE DISABILITY
98.1/ 100
METRIC RATING
111th/ 347
METRIC RANK
11.7%
FEMALE DISABILITY
98.1/ 100
METRIC RATING
110th/ 347
METRIC RANK
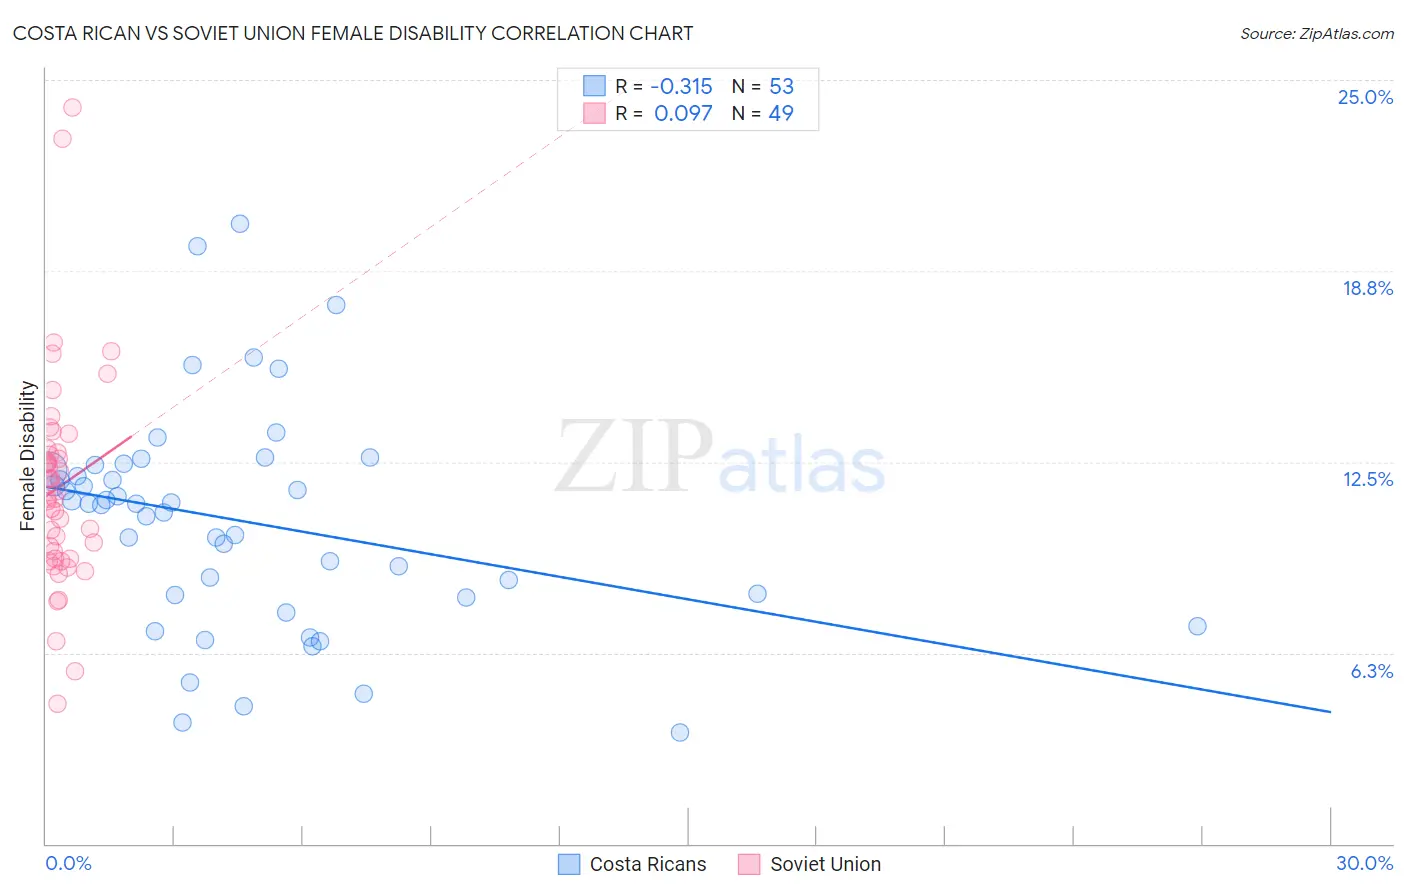
Costa Rican vs Soviet Union Female Disability Correlation Chart
The statistical analysis conducted on geographies consisting of 253,556,053 people shows a mild negative correlation between the proportion of Costa Ricans and percentage of females with a disability in the United States with a correlation coefficient (R) of -0.315 and weighted average of 11.7%. Similarly, the statistical analysis conducted on geographies consisting of 43,504,651 people shows a slight positive correlation between the proportion of Soviet Union and percentage of females with a disability in the United States with a correlation coefficient (R) of 0.097 and weighted average of 11.7%, a difference of 0.020%.
Female Disability Correlation Summary
| Measurement | Costa Rican | Soviet Union |
| Minimum | 3.6% | 4.6% |
| Maximum | 20.3% | 24.1% |
| Range | 16.7% | 19.5% |
| Mean | 10.6% | 11.7% |
| Median | 11.1% | 11.3% |
| Interquartile 25% (IQ1) | 8.1% | 9.3% |
| Interquartile 75% (IQ3) | 12.3% | 12.9% |
| Interquartile Range (IQR) | 4.2% | 3.5% |
| Standard Deviation (Sample) | 3.6% | 3.5% |
| Standard Deviation (Population) | 3.6% | 3.5% |
Demographics Similar to Costa Ricans and Soviet Union by Female Disability
In terms of female disability, the demographic groups most similar to Costa Ricans are Immigrants (11.7%, a difference of 0.020%), New Zealander (11.7%, a difference of 0.050%), Latvian (11.7%, a difference of 0.070%), Immigrants from Greece (11.7%, a difference of 0.090%), and Australian (11.7%, a difference of 0.12%). Similarly, the demographic groups most similar to Soviet Union are Immigrants (11.7%, a difference of 0.0%), New Zealander (11.7%, a difference of 0.030%), Latvian (11.7%, a difference of 0.050%), Immigrants from Greece (11.7%, a difference of 0.080%), and Australian (11.7%, a difference of 0.11%).
| Demographics | Rating | Rank | Female Disability |
| Immigrants | Uruguay | 98.5 /100 | #100 | Exceptional 11.7% |
| Immigrants | Costa Rica | 98.4 /100 | #101 | Exceptional 11.7% |
| Immigrants | South Eastern Asia | 98.4 /100 | #102 | Exceptional 11.7% |
| Immigrants | Eastern Africa | 98.3 /100 | #103 | Exceptional 11.7% |
| Immigrants | Western Asia | 98.3 /100 | #104 | Exceptional 11.7% |
| Australians | 98.3 /100 | #105 | Exceptional 11.7% |
| Immigrants | Greece | 98.2 /100 | #106 | Exceptional 11.7% |
| Latvians | 98.2 /100 | #107 | Exceptional 11.7% |
| New Zealanders | 98.1 /100 | #108 | Exceptional 11.7% |
| Immigrants | Immigrants | 98.1 /100 | #109 | Exceptional 11.7% |
| Soviet Union | 98.1 /100 | #110 | Exceptional 11.7% |
| Costa Ricans | 98.1 /100 | #111 | Exceptional 11.7% |
| Immigrants | Bangladesh | 97.8 /100 | #112 | Exceptional 11.8% |
| Immigrants | Belarus | 97.8 /100 | #113 | Exceptional 11.8% |
| South Africans | 97.7 /100 | #114 | Exceptional 11.8% |
| Brazilians | 97.7 /100 | #115 | Exceptional 11.8% |
| Immigrants | Morocco | 97.6 /100 | #116 | Exceptional 11.8% |
| Immigrants | Eastern Europe | 97.2 /100 | #117 | Exceptional 11.8% |
| Immigrants | Nigeria | 97.2 /100 | #118 | Exceptional 11.8% |
| Immigrants | Uganda | 97.2 /100 | #119 | Exceptional 11.8% |
| Immigrants | Kazakhstan | 97.0 /100 | #120 | Exceptional 11.8% |