Kenyan vs Spaniard Female Disability
COMPARE
Kenyan
Spaniard
Female Disability
Female Disability Comparison
Kenyans
Spaniards
11.9%
FEMALE DISABILITY
94.5/ 100
METRIC RATING
133rd/ 347
METRIC RANK
12.8%
FEMALE DISABILITY
0.7/ 100
METRIC RATING
263rd/ 347
METRIC RANK
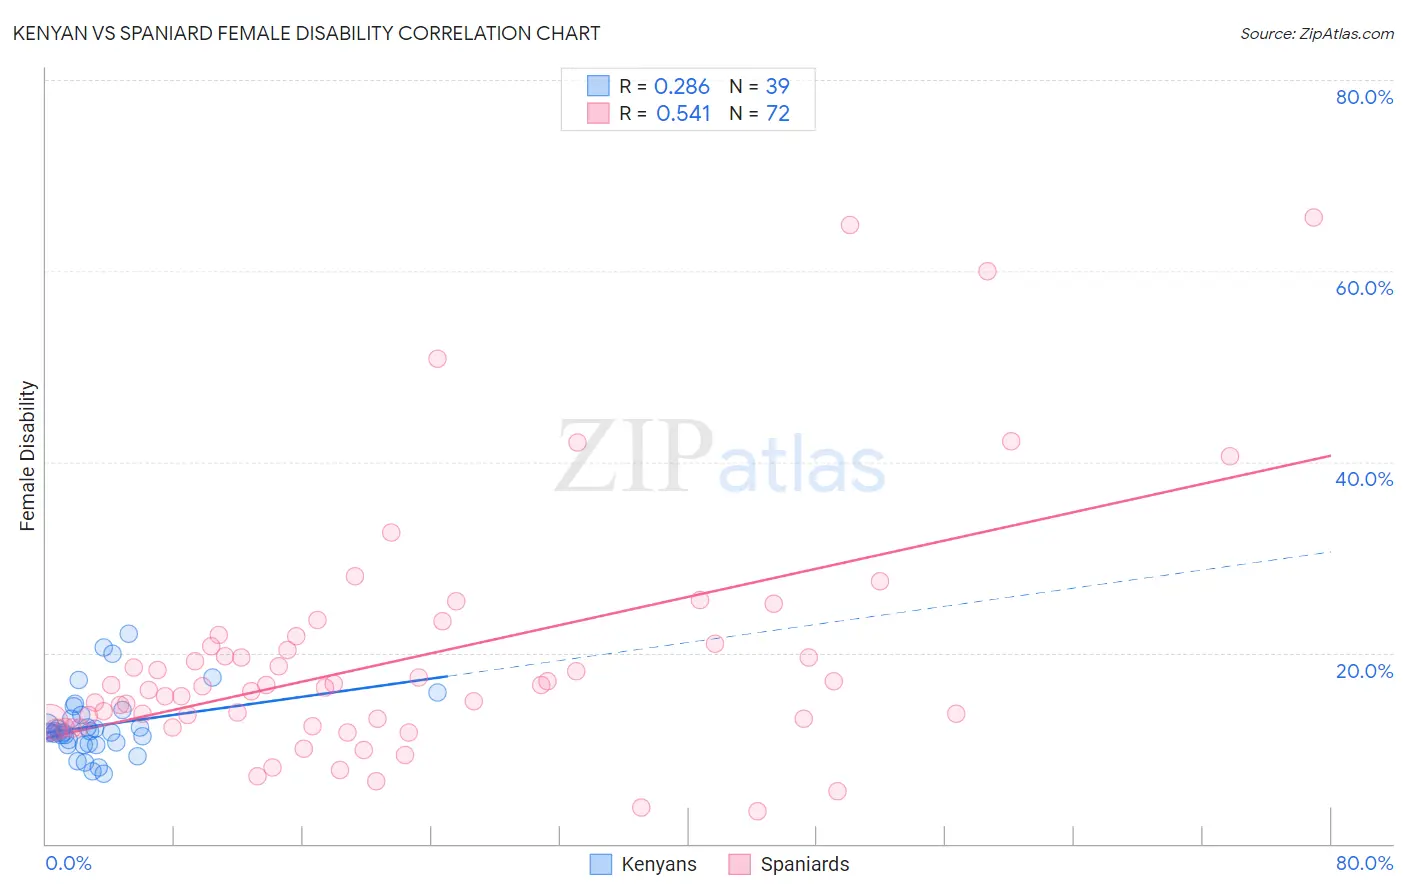
Kenyan vs Spaniard Female Disability Correlation Chart
The statistical analysis conducted on geographies consisting of 168,210,759 people shows a weak positive correlation between the proportion of Kenyans and percentage of females with a disability in the United States with a correlation coefficient (R) of 0.286 and weighted average of 11.9%. Similarly, the statistical analysis conducted on geographies consisting of 443,418,073 people shows a substantial positive correlation between the proportion of Spaniards and percentage of females with a disability in the United States with a correlation coefficient (R) of 0.541 and weighted average of 12.8%, a difference of 7.6%.
Female Disability Correlation Summary
| Measurement | Kenyan | Spaniard |
| Minimum | 7.3% | 3.4% |
| Maximum | 22.0% | 65.6% |
| Range | 14.6% | 62.2% |
| Mean | 12.4% | 19.4% |
| Median | 11.7% | 16.4% |
| Interquartile 25% (IQ1) | 10.5% | 12.5% |
| Interquartile 75% (IQ3) | 13.4% | 20.8% |
| Interquartile Range (IQR) | 2.9% | 8.3% |
| Standard Deviation (Sample) | 3.3% | 12.6% |
| Standard Deviation (Population) | 3.3% | 12.5% |
Similar Demographics by Female Disability
Demographics Similar to Kenyans by Female Disability
In terms of female disability, the demographic groups most similar to Kenyans are Immigrants from Nicaragua (11.9%, a difference of 0.0%), Immigrants from Syria (11.9%, a difference of 0.010%), Central American (11.9%, a difference of 0.070%), Ugandan (11.9%, a difference of 0.090%), and Arab (11.9%, a difference of 0.11%).
| Demographics | Rating | Rank | Female Disability |
| Immigrants | Europe | 96.2 /100 | #126 | Exceptional 11.8% |
| South American Indians | 95.8 /100 | #127 | Exceptional 11.8% |
| Immigrants | Latvia | 95.6 /100 | #128 | Exceptional 11.8% |
| Macedonians | 95.5 /100 | #129 | Exceptional 11.8% |
| Nicaraguans | 95.2 /100 | #130 | Exceptional 11.9% |
| Arabs | 95.1 /100 | #131 | Exceptional 11.9% |
| Immigrants | Syria | 94.6 /100 | #132 | Exceptional 11.9% |
| Kenyans | 94.5 /100 | #133 | Exceptional 11.9% |
| Immigrants | Nicaragua | 94.5 /100 | #134 | Exceptional 11.9% |
| Central Americans | 94.2 /100 | #135 | Exceptional 11.9% |
| Ugandans | 94.0 /100 | #136 | Exceptional 11.9% |
| Immigrants | Norway | 93.8 /100 | #137 | Exceptional 11.9% |
| Ecuadorians | 93.4 /100 | #138 | Exceptional 11.9% |
| Immigrants | Hungary | 92.8 /100 | #139 | Exceptional 11.9% |
| Romanians | 91.6 /100 | #140 | Exceptional 11.9% |
Demographics Similar to Spaniards by Female Disability
In terms of female disability, the demographic groups most similar to Spaniards are Alaska Native (12.8%, a difference of 0.12%), Czechoslovakian (12.7%, a difference of 0.23%), Bermudan (12.7%, a difference of 0.30%), West Indian (12.8%, a difference of 0.31%), and Subsaharan African (12.7%, a difference of 0.34%).
| Demographics | Rating | Rank | Female Disability |
| British West Indians | 1.2 /100 | #256 | Tragic 12.7% |
| Liberians | 1.1 /100 | #257 | Tragic 12.7% |
| Aleuts | 1.1 /100 | #258 | Tragic 12.7% |
| Immigrants | Armenia | 1.0 /100 | #259 | Tragic 12.7% |
| Sub-Saharan Africans | 1.0 /100 | #260 | Tragic 12.7% |
| Bermudans | 1.0 /100 | #261 | Tragic 12.7% |
| Czechoslovakians | 0.9 /100 | #262 | Tragic 12.7% |
| Spaniards | 0.7 /100 | #263 | Tragic 12.8% |
| Alaska Natives | 0.6 /100 | #264 | Tragic 12.8% |
| West Indians | 0.5 /100 | #265 | Tragic 12.8% |
| Finns | 0.4 /100 | #266 | Tragic 12.8% |
| Senegalese | 0.4 /100 | #267 | Tragic 12.8% |
| Immigrants | Laos | 0.4 /100 | #268 | Tragic 12.8% |
| Indonesians | 0.4 /100 | #269 | Tragic 12.8% |
| Immigrants | Liberia | 0.3 /100 | #270 | Tragic 12.9% |