Costa Rican vs Mexican American Indian Female Disability
COMPARE
Costa Rican
Mexican American Indian
Female Disability
Female Disability Comparison
Costa Ricans
Mexican American Indians
11.7%
FEMALE DISABILITY
98.1/ 100
METRIC RATING
111th/ 347
METRIC RANK
12.3%
FEMALE DISABILITY
24.9/ 100
METRIC RATING
198th/ 347
METRIC RANK
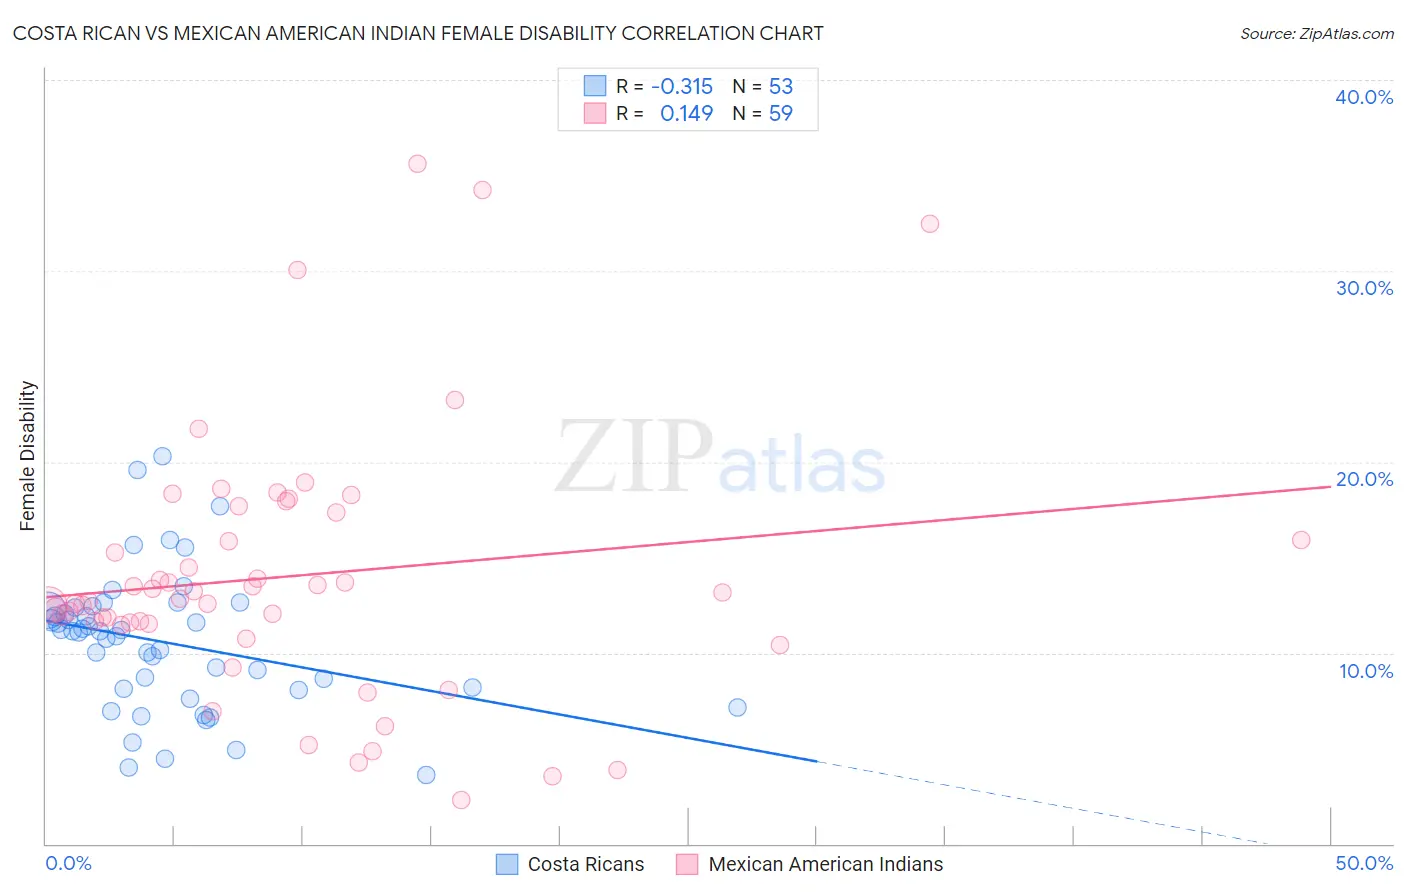
Costa Rican vs Mexican American Indian Female Disability Correlation Chart
The statistical analysis conducted on geographies consisting of 253,556,053 people shows a mild negative correlation between the proportion of Costa Ricans and percentage of females with a disability in the United States with a correlation coefficient (R) of -0.315 and weighted average of 11.7%. Similarly, the statistical analysis conducted on geographies consisting of 317,566,879 people shows a poor positive correlation between the proportion of Mexican American Indians and percentage of females with a disability in the United States with a correlation coefficient (R) of 0.149 and weighted average of 12.3%, a difference of 4.9%.
Female Disability Correlation Summary
| Measurement | Costa Rican | Mexican American Indian |
| Minimum | 3.6% | 2.3% |
| Maximum | 20.3% | 35.6% |
| Range | 16.7% | 33.3% |
| Mean | 10.6% | 14.0% |
| Median | 11.1% | 12.8% |
| Interquartile 25% (IQ1) | 8.1% | 11.5% |
| Interquartile 75% (IQ3) | 12.3% | 17.3% |
| Interquartile Range (IQR) | 4.2% | 5.8% |
| Standard Deviation (Sample) | 3.6% | 6.8% |
| Standard Deviation (Population) | 3.6% | 6.8% |
Similar Demographics by Female Disability
Demographics Similar to Costa Ricans by Female Disability
In terms of female disability, the demographic groups most similar to Costa Ricans are Immigrants (11.7%, a difference of 0.020%), Soviet Union (11.7%, a difference of 0.020%), New Zealander (11.7%, a difference of 0.050%), Latvian (11.7%, a difference of 0.070%), and Immigrants from Greece (11.7%, a difference of 0.090%).
| Demographics | Rating | Rank | Female Disability |
| Immigrants | Western Asia | 98.3 /100 | #104 | Exceptional 11.7% |
| Australians | 98.3 /100 | #105 | Exceptional 11.7% |
| Immigrants | Greece | 98.2 /100 | #106 | Exceptional 11.7% |
| Latvians | 98.2 /100 | #107 | Exceptional 11.7% |
| New Zealanders | 98.1 /100 | #108 | Exceptional 11.7% |
| Immigrants | Immigrants | 98.1 /100 | #109 | Exceptional 11.7% |
| Soviet Union | 98.1 /100 | #110 | Exceptional 11.7% |
| Costa Ricans | 98.1 /100 | #111 | Exceptional 11.7% |
| Immigrants | Bangladesh | 97.8 /100 | #112 | Exceptional 11.8% |
| Immigrants | Belarus | 97.8 /100 | #113 | Exceptional 11.8% |
| South Africans | 97.7 /100 | #114 | Exceptional 11.8% |
| Brazilians | 97.7 /100 | #115 | Exceptional 11.8% |
| Immigrants | Morocco | 97.6 /100 | #116 | Exceptional 11.8% |
| Immigrants | Eastern Europe | 97.2 /100 | #117 | Exceptional 11.8% |
| Immigrants | Nigeria | 97.2 /100 | #118 | Exceptional 11.8% |
Demographics Similar to Mexican American Indians by Female Disability
In terms of female disability, the demographic groups most similar to Mexican American Indians are Immigrants from Trinidad and Tobago (12.3%, a difference of 0.010%), Immigrants from Panama (12.3%, a difference of 0.030%), Honduran (12.3%, a difference of 0.030%), Swedish (12.3%, a difference of 0.080%), and Ukrainian (12.3%, a difference of 0.11%).
| Demographics | Rating | Rank | Female Disability |
| Armenians | 29.7 /100 | #191 | Fair 12.3% |
| Immigrants | Western Africa | 29.2 /100 | #192 | Fair 12.3% |
| Northern Europeans | 27.5 /100 | #193 | Fair 12.3% |
| Ukrainians | 27.2 /100 | #194 | Fair 12.3% |
| Swedes | 26.6 /100 | #195 | Fair 12.3% |
| Immigrants | Panama | 25.5 /100 | #196 | Fair 12.3% |
| Hondurans | 25.4 /100 | #197 | Fair 12.3% |
| Mexican American Indians | 24.9 /100 | #198 | Fair 12.3% |
| Immigrants | Trinidad and Tobago | 24.7 /100 | #199 | Fair 12.3% |
| Trinidadians and Tobagonians | 22.4 /100 | #200 | Fair 12.3% |
| Chinese | 22.1 /100 | #201 | Fair 12.3% |
| Somalis | 21.5 /100 | #202 | Fair 12.3% |
| Immigrants | Barbados | 21.1 /100 | #203 | Fair 12.3% |
| Immigrants | Zaire | 20.9 /100 | #204 | Fair 12.3% |
| Immigrants | Grenada | 20.5 /100 | #205 | Fair 12.4% |