Arab vs Soviet Union Female Disability
COMPARE
Arab
Soviet Union
Female Disability
Female Disability Comparison
Arabs
Soviet Union
11.9%
FEMALE DISABILITY
95.1/ 100
METRIC RATING
131st/ 347
METRIC RANK
11.7%
FEMALE DISABILITY
98.1/ 100
METRIC RATING
110th/ 347
METRIC RANK
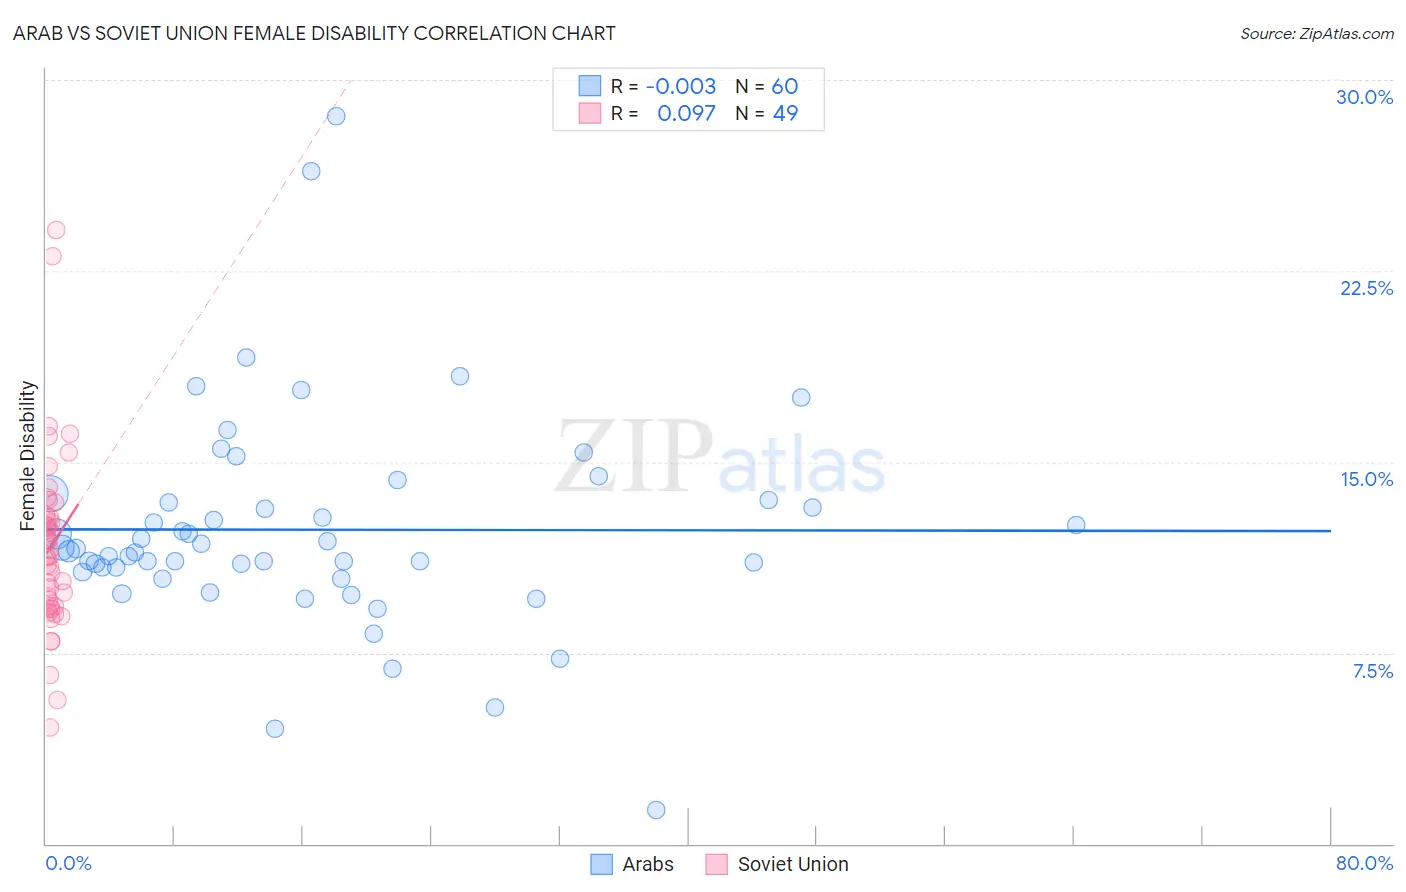
Arab vs Soviet Union Female Disability Correlation Chart
The statistical analysis conducted on geographies consisting of 486,755,725 people shows no correlation between the proportion of Arabs and percentage of females with a disability in the United States with a correlation coefficient (R) of -0.003 and weighted average of 11.9%. Similarly, the statistical analysis conducted on geographies consisting of 43,504,651 people shows a slight positive correlation between the proportion of Soviet Union and percentage of females with a disability in the United States with a correlation coefficient (R) of 0.097 and weighted average of 11.7%, a difference of 0.95%.
Female Disability Correlation Summary
| Measurement | Arab | Soviet Union |
| Minimum | 1.3% | 4.6% |
| Maximum | 28.6% | 24.1% |
| Range | 27.3% | 19.5% |
| Mean | 12.3% | 11.7% |
| Median | 11.5% | 11.3% |
| Interquartile 25% (IQ1) | 10.8% | 9.3% |
| Interquartile 75% (IQ3) | 13.4% | 12.9% |
| Interquartile Range (IQR) | 2.7% | 3.5% |
| Standard Deviation (Sample) | 4.3% | 3.5% |
| Standard Deviation (Population) | 4.2% | 3.5% |
Similar Demographics by Female Disability
Demographics Similar to Arabs by Female Disability
In terms of female disability, the demographic groups most similar to Arabs are Nicaraguan (11.9%, a difference of 0.030%), Macedonian (11.8%, a difference of 0.090%), Immigrants from Syria (11.9%, a difference of 0.10%), Kenyan (11.9%, a difference of 0.11%), and Immigrants from Nicaragua (11.9%, a difference of 0.11%).
| Demographics | Rating | Rank | Female Disability |
| Russians | 96.5 /100 | #124 | Exceptional 11.8% |
| Immigrants | Italy | 96.4 /100 | #125 | Exceptional 11.8% |
| Immigrants | Europe | 96.2 /100 | #126 | Exceptional 11.8% |
| South American Indians | 95.8 /100 | #127 | Exceptional 11.8% |
| Immigrants | Latvia | 95.6 /100 | #128 | Exceptional 11.8% |
| Macedonians | 95.5 /100 | #129 | Exceptional 11.8% |
| Nicaraguans | 95.2 /100 | #130 | Exceptional 11.9% |
| Arabs | 95.1 /100 | #131 | Exceptional 11.9% |
| Immigrants | Syria | 94.6 /100 | #132 | Exceptional 11.9% |
| Kenyans | 94.5 /100 | #133 | Exceptional 11.9% |
| Immigrants | Nicaragua | 94.5 /100 | #134 | Exceptional 11.9% |
| Central Americans | 94.2 /100 | #135 | Exceptional 11.9% |
| Ugandans | 94.0 /100 | #136 | Exceptional 11.9% |
| Immigrants | Norway | 93.8 /100 | #137 | Exceptional 11.9% |
| Ecuadorians | 93.4 /100 | #138 | Exceptional 11.9% |
Demographics Similar to Soviet Union by Female Disability
In terms of female disability, the demographic groups most similar to Soviet Union are Immigrants (11.7%, a difference of 0.0%), Costa Rican (11.7%, a difference of 0.020%), New Zealander (11.7%, a difference of 0.030%), Latvian (11.7%, a difference of 0.050%), and Immigrants from Greece (11.7%, a difference of 0.080%).
| Demographics | Rating | Rank | Female Disability |
| Immigrants | Eastern Africa | 98.3 /100 | #103 | Exceptional 11.7% |
| Immigrants | Western Asia | 98.3 /100 | #104 | Exceptional 11.7% |
| Australians | 98.3 /100 | #105 | Exceptional 11.7% |
| Immigrants | Greece | 98.2 /100 | #106 | Exceptional 11.7% |
| Latvians | 98.2 /100 | #107 | Exceptional 11.7% |
| New Zealanders | 98.1 /100 | #108 | Exceptional 11.7% |
| Immigrants | Immigrants | 98.1 /100 | #109 | Exceptional 11.7% |
| Soviet Union | 98.1 /100 | #110 | Exceptional 11.7% |
| Costa Ricans | 98.1 /100 | #111 | Exceptional 11.7% |
| Immigrants | Bangladesh | 97.8 /100 | #112 | Exceptional 11.8% |
| Immigrants | Belarus | 97.8 /100 | #113 | Exceptional 11.8% |
| South Africans | 97.7 /100 | #114 | Exceptional 11.8% |
| Brazilians | 97.7 /100 | #115 | Exceptional 11.8% |
| Immigrants | Morocco | 97.6 /100 | #116 | Exceptional 11.8% |
| Immigrants | Eastern Europe | 97.2 /100 | #117 | Exceptional 11.8% |