Immigrants from Hungary vs Soviet Union Female Disability

COMPARE

Immigrants from Hungary
Race
Ancestry
AfghanAfricanAlaska NativeAlaskan AthabascanAlbanianAleutAlsatianAmericanApacheArabArapahoArgentineanArmenianAssyrian/Chaldean/SyriacAustralianAustrianBahamianBangladeshiBarbadianBasqueBelgianBelizeanBermudanBhutaneseBlackfeetBolivianBrazilianBritishBritish West IndianBulgarianBurmeseCajunCambodianCanadianCape VerdeanCarpatho RusynCelticCentral AmericanCentral American IndianCherokeeCheyenneChickasawChileanChineseChippewaChoctawColombianColvilleComancheCosta RicanCreeCreekCroatianCrowCubanCypriotCzechCzechoslovakianDanishDelawareDominicanDutchDutch West IndianEastern EuropeanEcuadorianEgyptianEnglishEstonianEthiopianEuropeanFijianFilipinoFinnishFrenchFrench American IndianFrench CanadianGermanGerman RussianGhanaianGreekGuamanian/ChamorroGuatemalanGuyaneseHaitianHmongHonduranHopiHoumaHungarianIcelanderIndian (Asian)IndonesianInupiatIranianIraqiIrishIroquoisIsraeliItalianJamaicanJapaneseJordanianKenyanKiowaKoreanLaotianLatvianLebaneseLiberianLithuanianLumbeeLuxembourgerMacedonianMalaysianMalteseMarshalleseMenomineeMexicanMexican American IndianMongolianMoroccanNative HawaiianNavajoNepaleseNew ZealanderNicaraguanNigerianNorthern EuropeanNorwegianOkinawanOsageOttawaPaiutePakistaniPalestinianPanamanianParaguayanPennsylvania GermanPeruvianPimaPolishPortuguesePotawatomiPuebloPuerto RicanPuget Sound SalishRomanianRussianSalvadoranSamoanScandinavianScotch-IrishScottishSeminoleSenegaleseSerbianShoshoneSierra LeoneanSiouxSlavicSlovakSloveneSomaliSouth AfricanSouth AmericanSouth American IndianSpaniardSpanishSpanish AmericanSpanish American IndianSri LankanSubsaharan AfricanSudaneseSwedishSwissSyrianTaiwaneseThaiTlingit-HaidaTohono O'OdhamTonganTrinidadian and TobagonianTsimshianTurkishU.S. Virgin IslanderUgandanUkrainianUruguayanUteVenezuelanVietnameseWelshWest IndianYakamaYaquiYugoslavianYumanYup'ikZimbabwean
Immigration
NonimmigrantsImmigrantsAfghanistanAfricaAlbaniaArgentinaArmeniaAsiaAustraliaAustriaBahamasBangladeshBarbadosBelarusBelgiumBelizeBoliviaBosnia and HerzegovinaBrazilBulgariaBurma/MyanmarCabo VerdeCambodiaCameroonCanadaCaribbeanCentral AmericaChileChinaColombiaCongoCosta RicaCroatiaCubaCzechoslovakiaDenmarkDominicaDominican RepublicEastern AfricaEastern AsiaEastern EuropeEcuadorEgyptEl SalvadorEnglandEritreaEthiopiaEuropeFijiFranceGermanyGhanaGreeceGrenadaGuatemalaGuyanaHaitiHondurasHong KongHungaryIndiaIndonesiaIranIraqIrelandIsraelItalyJamaicaJapanJordanKazakhstanKenyaKoreaKuwaitLaosLatin AmericaLatviaLebanonLiberiaLithuaniaMalaysiaMexicoMicronesiaMiddle AfricaMoldovaMoroccoNepalNetherlandsNicaraguaNigeriaNorth AmericaNorth MacedoniaNorthern AfricaNorthern EuropeNorwayOceaniaPakistanPanamaPeruPhilippinesPolandPortugalRomaniaRussiaSaudi ArabiaScotlandSenegalSerbiaSierra LeoneSingaporeSomaliaSouth AfricaSouth AmericaSouth Central AsiaSouth Eastern AsiaSouthern EuropeSpainSri LankaSt. Vincent and the GrenadinesSudanSwedenSwitzerlandSyriaTaiwanThailandTrinidad and TobagoTurkeyUgandaUkraineUruguayUzbekistanVenezuelaVietnamWest IndiesWestern AfricaWestern AsiaWestern EuropeYemenZaireZimbabweAzores
Soviet Union
Race
Ancestry
AfghanAfricanAlaska NativeAlaskan AthabascanAlbanianAleutAlsatianAmericanApacheArabArapahoArgentineanArmenianAssyrian/Chaldean/SyriacAustralianAustrianBahamianBangladeshiBarbadianBasqueBelgianBelizeanBermudanBhutaneseBlackfeetBolivianBrazilianBritishBritish West IndianBulgarianBurmeseCajunCambodianCanadianCape VerdeanCarpatho RusynCelticCentral AmericanCentral American IndianCherokeeCheyenneChickasawChileanChineseChippewaChoctawColombianColvilleComancheCosta RicanCreeCreekCroatianCrowCubanCypriotCzechCzechoslovakianDanishDelawareDominicanDutchDutch West IndianEastern EuropeanEcuadorianEgyptianEnglishEstonianEthiopianEuropeanFijianFilipinoFinnishFrenchFrench American IndianFrench CanadianGermanGerman RussianGhanaianGreekGuamanian/ChamorroGuatemalanGuyaneseHaitianHmongHonduranHopiHoumaHungarianIcelanderIndian (Asian)IndonesianInupiatIranianIraqiIrishIroquoisIsraeliItalianJamaicanJapaneseJordanianKenyanKiowaKoreanLaotianLatvianLebaneseLiberianLithuanianLumbeeLuxembourgerMacedonianMalaysianMalteseMarshalleseMenomineeMexicanMexican American IndianMongolianMoroccanNative HawaiianNavajoNepaleseNew ZealanderNicaraguanNigerianNorthern EuropeanNorwegianOkinawanOsageOttawaPaiutePakistaniPalestinianPanamanianParaguayanPennsylvania GermanPeruvianPimaPolishPortuguesePotawatomiPuebloPuerto RicanPuget Sound SalishRomanianRussianSalvadoranSamoanScandinavianScotch-IrishScottishSeminoleSenegaleseSerbianShoshoneSierra LeoneanSiouxSlavicSlovakSloveneSomaliSouth AfricanSouth AmericanSouth American IndianSoviet UnionSpaniardSpanishSpanish AmericanSpanish American IndianSri LankanSubsaharan AfricanSudaneseSwedishSwissSyrianTaiwaneseThaiTlingit-HaidaTohono O'OdhamTonganTrinidadian and TobagonianTsimshianTurkishU.S. Virgin IslanderUgandanUkrainianUruguayanUteVenezuelanVietnameseWelshWest IndianYakamaYaquiYugoslavianYumanYup'ikZimbabwean
Immigration
NonimmigrantsImmigrantsAfghanistanAfricaAlbaniaArgentinaArmeniaAsiaAustraliaAustriaBahamasBangladeshBarbadosBelarusBelgiumBelizeBoliviaBosnia and HerzegovinaBrazilBulgariaBurma/MyanmarCabo VerdeCambodiaCameroonCanadaCaribbeanCentral AmericaChileChinaColombiaCongoCosta RicaCroatiaCubaCzechoslovakiaDenmarkDominicaDominican RepublicEastern AfricaEastern AsiaEastern EuropeEcuadorEgyptEl SalvadorEnglandEritreaEthiopiaEuropeFijiFranceGermanyGhanaGreeceGrenadaGuatemalaGuyanaHaitiHondurasHong KongIndiaIndonesiaIranIraqIrelandIsraelItalyJamaicaJapanJordanKazakhstanKenyaKoreaKuwaitLaosLatin AmericaLatviaLebanonLiberiaLithuaniaMalaysiaMexicoMicronesiaMiddle AfricaMoldovaMoroccoNepalNetherlandsNicaraguaNigeriaNorth AmericaNorth MacedoniaNorthern AfricaNorthern EuropeNorwayOceaniaPakistanPanamaPeruPhilippinesPolandPortugalRomaniaRussiaSaudi ArabiaScotlandSenegalSerbiaSierra LeoneSingaporeSomaliaSouth AfricaSouth AmericaSouth Central AsiaSouth Eastern AsiaSouthern EuropeSpainSri LankaSt. Vincent and the GrenadinesSudanSwedenSwitzerlandSyriaTaiwanThailandTrinidad and TobagoTurkeyUgandaUkraineUruguayUzbekistanVenezuelaVietnamWest IndiesWestern AfricaWestern AsiaWestern EuropeYemenZaireZimbabweAzores
Female Disability
Income
Poverty
Unemployment
Labor Participation
Family Structure
Vehicle Availability
Education Level
Disability

Female Disability Comparison

Immigrants from Hungary

Soviet Union

Exceptional
Exceptional
11.9%
FEMALE DISABILITY
92.8/ 100
METRIC RATING
139th/ 347
METRIC RANK
11.7%
FEMALE DISABILITY
98.1/ 100
METRIC RATING
110th/ 347
METRIC RANK

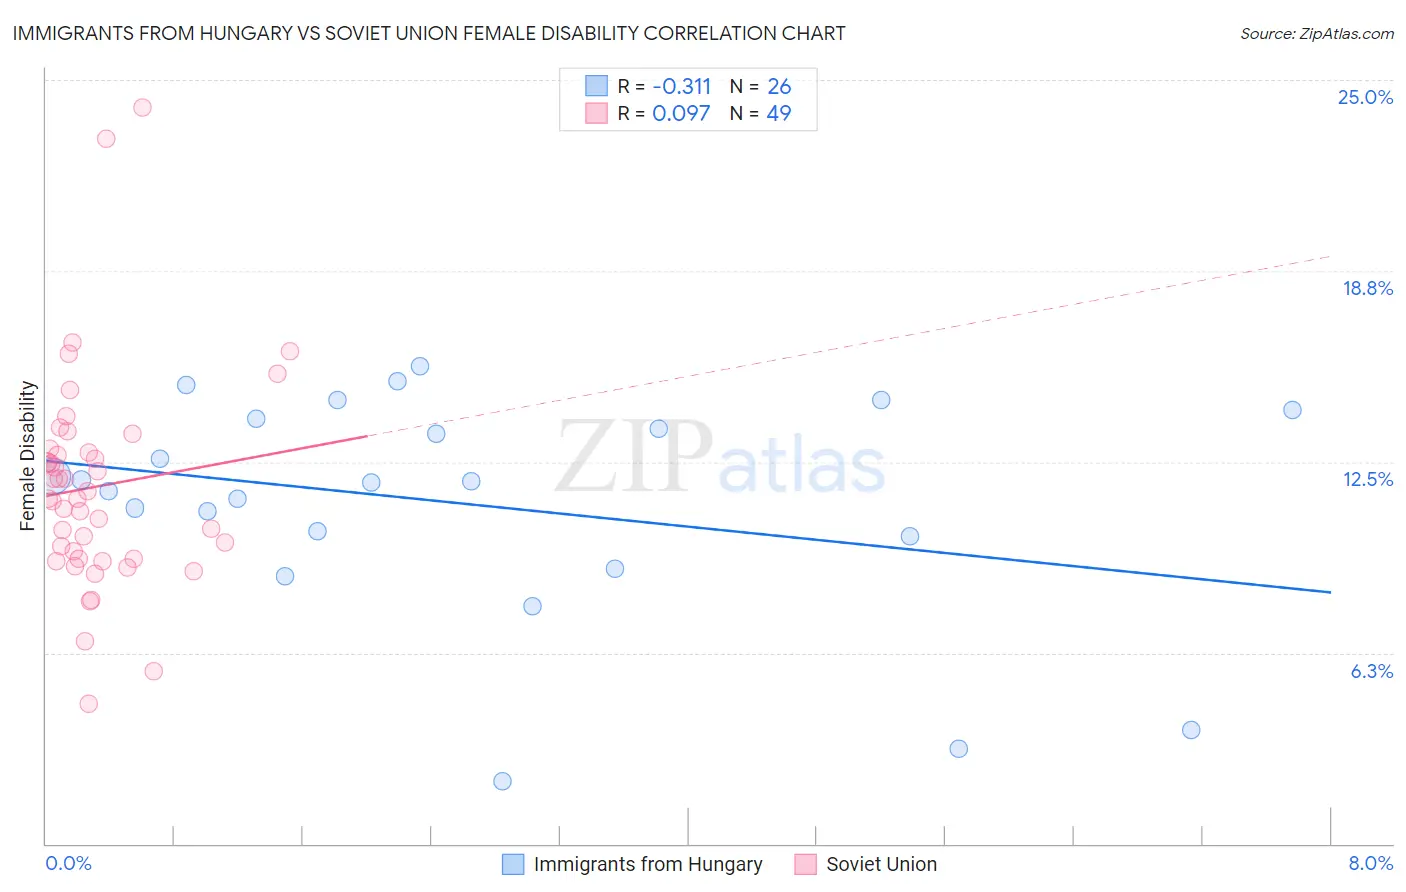
Immigrants from Hungary vs Soviet Union Female Disability Correlation Chart

The statistical analysis conducted on geographies consisting of 195,708,116 people shows a mild negative correlation between the proportion of Immigrants from Hungary and percentage of females with a disability in the United States with a correlation coefficient (R) of -0.311 and weighted average of 11.9%. Similarly, the statistical analysis conducted on geographies consisting of 43,504,651 people shows a slight positive correlation between the proportion of Soviet Union and percentage of females with a disability in the United States with a correlation coefficient (R) of 0.097 and weighted average of 11.7%, a difference of 1.3%.
Immigrants from Hungary vs Soviet Union Female Disability

Female Disability Correlation Summary

MeasurementImmigrants from HungarySoviet Union
Minimum2.0%4.6%
Maximum15.6%24.1%
Range13.6%19.5%
Mean11.1%11.7%
Median11.8%11.3%
Interquartile 25% (IQ1)10.1%9.3%
Interquartile 75% (IQ3)13.9%12.9%
Interquartile Range (IQR)3.8%3.5%
Standard Deviation (Sample)3.6%3.5%
Standard Deviation (Population)3.6%3.5%

Similar Demographics by Female Disability

Demographics Similar to Immigrants from Hungary by Female Disability

In terms of female disability, the demographic groups most similar to Immigrants from Hungary are Ecuadorian (11.9%, a difference of 0.090%), Immigrants from Norway (11.9%, a difference of 0.15%), Romanian (11.9%, a difference of 0.16%), Immigrants from Ecuador (11.9%, a difference of 0.18%), and Ugandan (11.9%, a difference of 0.19%).
DemographicsRating | RankFemale Disability
Immigrants | Syria
94.6
/100
|
#132
Exceptional
11.9%
Kenyans
94.5
/100
|
#133
Exceptional
11.9%
Immigrants | Nicaragua
94.5
/100
|
#134
Exceptional
11.9%
Central Americans
94.2
/100
|
#135
Exceptional
11.9%
Ugandans
94.0
/100
|
#136
Exceptional
11.9%
Immigrants | Norway
93.8
/100
|
#137
Exceptional
11.9%
Ecuadorians
93.4
/100
|
#138
Exceptional
11.9%
Immigrants | Hungary
92.8
/100
|
#139
Exceptional
11.9%
Romanians
91.6
/100
|
#140
Exceptional
11.9%
Immigrants | Ecuador
91.5
/100
|
#141
Exceptional
11.9%
Immigrants | Africa
90.0
/100
|
#142
Excellent
11.9%
Immigrants | Sudan
89.6
/100
|
#143
Excellent
11.9%
Immigrants | Austria
87.9
/100
|
#144
Excellent
12.0%
Estonians
87.8
/100
|
#145
Excellent
12.0%
Pakistanis
84.6
/100
|
#146
Excellent
12.0%

Demographics Similar to Soviet Union by Female Disability

In terms of female disability, the demographic groups most similar to Soviet Union are Immigrants (11.7%, a difference of 0.0%), Costa Rican (11.7%, a difference of 0.020%), New Zealander (11.7%, a difference of 0.030%), Latvian (11.7%, a difference of 0.050%), and Immigrants from Greece (11.7%, a difference of 0.080%).
DemographicsRating | RankFemale Disability
Immigrants | Eastern Africa
98.3
/100
|
#103
Exceptional
11.7%
Immigrants | Western Asia
98.3
/100
|
#104
Exceptional
11.7%
Australians
98.3
/100
|
#105
Exceptional
11.7%
Immigrants | Greece
98.2
/100
|
#106
Exceptional
11.7%
Latvians
98.2
/100
|
#107
Exceptional
11.7%
New Zealanders
98.1
/100
|
#108
Exceptional
11.7%
Immigrants | Immigrants
98.1
/100
|
#109
Exceptional
11.7%
Soviet Union
98.1
/100
|
#110
Exceptional
11.7%
Costa Ricans
98.1
/100
|
#111
Exceptional
11.7%
Immigrants | Bangladesh
97.8
/100
|
#112
Exceptional
11.8%
Immigrants | Belarus
97.8
/100
|
#113
Exceptional
11.8%
South Africans
97.7
/100
|
#114
Exceptional
11.8%
Brazilians
97.7
/100
|
#115
Exceptional
11.8%
Immigrants | Morocco
97.6
/100
|
#116
Exceptional
11.8%
Immigrants | Eastern Europe
97.2
/100
|
#117
Exceptional
11.8%