Costa Rican vs Iranian Disability Age 5 to 17
COMPARE
Costa Rican
Iranian
Disability Age 5 to 17
Disability Age 5 to 17 Comparison
Costa Ricans
Iranians
5.6%
DISABILITY AGE 5 TO 17
50.0/ 100
METRIC RATING
174th/ 347
METRIC RANK
4.6%
DISABILITY AGE 5 TO 17
100.0/ 100
METRIC RATING
12th/ 347
METRIC RANK
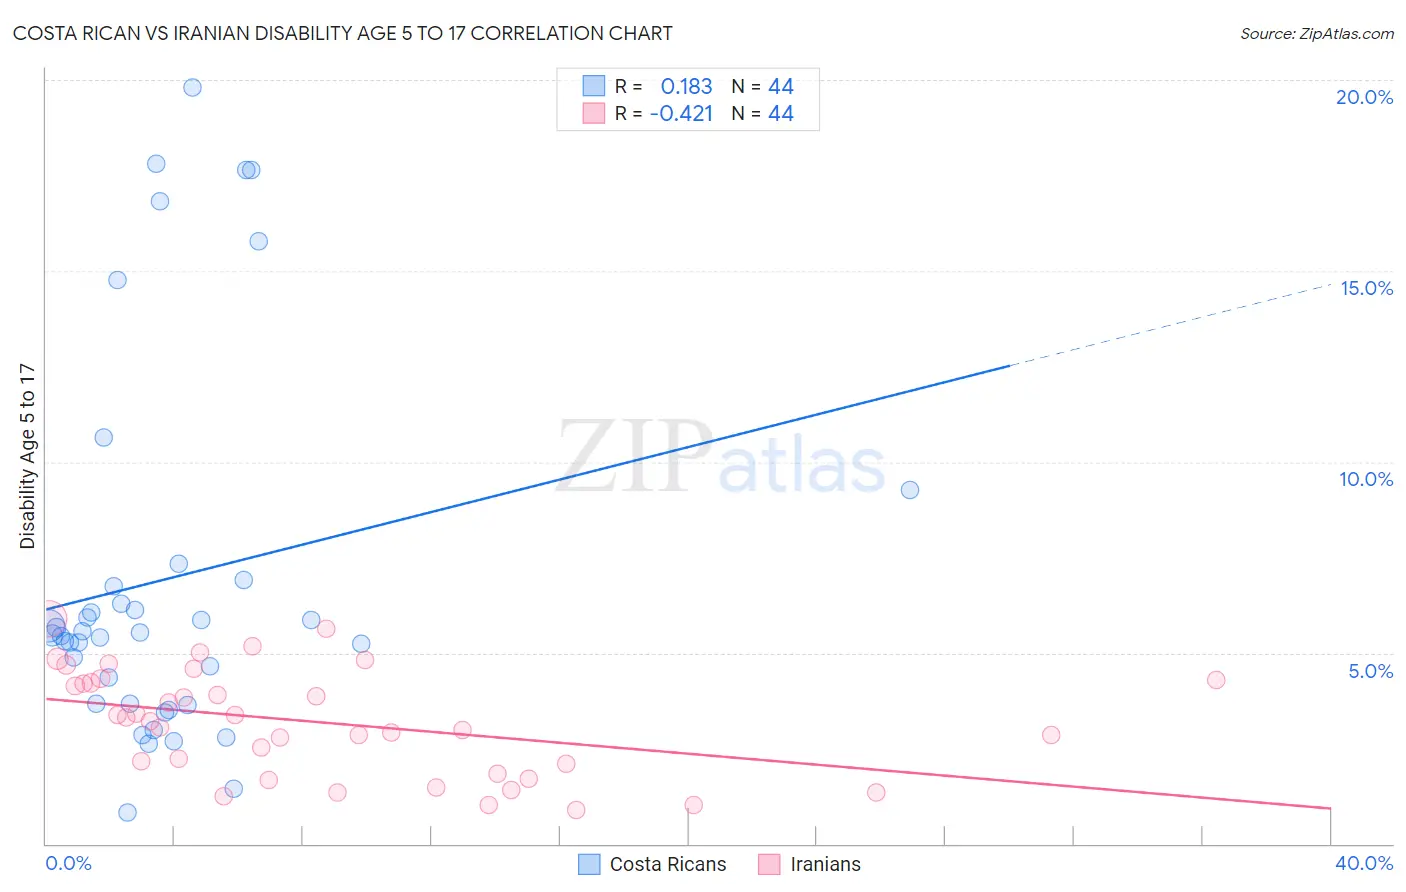
Costa Rican vs Iranian Disability Age 5 to 17 Correlation Chart
The statistical analysis conducted on geographies consisting of 252,489,466 people shows a poor positive correlation between the proportion of Costa Ricans and percentage of population with a disability between the ages 5 and 17 in the United States with a correlation coefficient (R) of 0.183 and weighted average of 5.6%. Similarly, the statistical analysis conducted on geographies consisting of 314,727,969 people shows a moderate negative correlation between the proportion of Iranians and percentage of population with a disability between the ages 5 and 17 in the United States with a correlation coefficient (R) of -0.421 and weighted average of 4.6%, a difference of 21.6%.
Disability Age 5 to 17 Correlation Summary
| Measurement | Costa Rican | Iranian |
| Minimum | 0.81% | 0.90% |
| Maximum | 19.8% | 5.9% |
| Range | 19.0% | 5.0% |
| Mean | 6.9% | 3.2% |
| Median | 5.5% | 3.3% |
| Interquartile 25% (IQ1) | 3.7% | 2.0% |
| Interquartile 75% (IQ3) | 6.8% | 4.2% |
| Interquartile Range (IQR) | 3.2% | 2.3% |
| Standard Deviation (Sample) | 4.9% | 1.4% |
| Standard Deviation (Population) | 4.8% | 1.4% |
Similar Demographics by Disability Age 5 to 17
Demographics Similar to Costa Ricans by Disability Age 5 to 17
In terms of disability age 5 to 17, the demographic groups most similar to Costa Ricans are Shoshone (5.6%, a difference of 0.030%), Immigrants from Central America (5.6%, a difference of 0.030%), Uruguayan (5.6%, a difference of 0.050%), Ukrainian (5.6%, a difference of 0.080%), and Immigrants from Western Europe (5.6%, a difference of 0.11%).
| Demographics | Rating | Rank | Disability Age 5 to 17 |
| Immigrants | Burma/Myanmar | 59.3 /100 | #167 | Average 5.6% |
| Iraqis | 56.0 /100 | #168 | Average 5.6% |
| Immigrants | Norway | 55.7 /100 | #169 | Average 5.6% |
| Serbians | 54.0 /100 | #170 | Average 5.6% |
| Immigrants | Iraq | 53.9 /100 | #171 | Average 5.6% |
| Ukrainians | 51.5 /100 | #172 | Average 5.6% |
| Uruguayans | 51.0 /100 | #173 | Average 5.6% |
| Costa Ricans | 50.0 /100 | #174 | Average 5.6% |
| Shoshone | 49.4 /100 | #175 | Average 5.6% |
| Immigrants | Central America | 49.4 /100 | #176 | Average 5.6% |
| Immigrants | Western Europe | 47.8 /100 | #177 | Average 5.6% |
| Immigrants | Trinidad and Tobago | 47.6 /100 | #178 | Average 5.6% |
| Immigrants | Barbados | 40.5 /100 | #179 | Average 5.6% |
| Immigrants | Uruguay | 37.7 /100 | #180 | Fair 5.6% |
| Immigrants | England | 36.4 /100 | #181 | Fair 5.6% |
Demographics Similar to Iranians by Disability Age 5 to 17
In terms of disability age 5 to 17, the demographic groups most similar to Iranians are Armenian (4.6%, a difference of 0.24%), Immigrants from India (4.6%, a difference of 0.40%), Immigrants from Eastern Asia (4.6%, a difference of 0.47%), Indian (Asian) (4.6%, a difference of 0.80%), and Thai (4.7%, a difference of 1.1%).
| Demographics | Rating | Rank | Disability Age 5 to 17 |
| Immigrants | Iran | 100.0 /100 | #5 | Exceptional 4.4% |
| Immigrants | Israel | 100.0 /100 | #6 | Exceptional 4.5% |
| Immigrants | China | 100.0 /100 | #7 | Exceptional 4.5% |
| Indians (Asian) | 100.0 /100 | #8 | Exceptional 4.6% |
| Immigrants | Eastern Asia | 100.0 /100 | #9 | Exceptional 4.6% |
| Immigrants | India | 100.0 /100 | #10 | Exceptional 4.6% |
| Armenians | 100.0 /100 | #11 | Exceptional 4.6% |
| Iranians | 100.0 /100 | #12 | Exceptional 4.6% |
| Thais | 100.0 /100 | #13 | Exceptional 4.7% |
| Immigrants | Korea | 100.0 /100 | #14 | Exceptional 4.7% |
| Chinese | 100.0 /100 | #15 | Exceptional 4.7% |
| Immigrants | Singapore | 100.0 /100 | #16 | Exceptional 4.7% |
| Arapaho | 100.0 /100 | #17 | Exceptional 4.7% |
| Immigrants | South Central Asia | 100.0 /100 | #18 | Exceptional 4.7% |
| Immigrants | Uzbekistan | 100.0 /100 | #19 | Exceptional 4.8% |