Comanche vs Immigrants from Latvia Female Disability
COMPARE
Comanche
Immigrants from Latvia
Female Disability
Female Disability Comparison
Comanche
Immigrants from Latvia
14.2%
FEMALE DISABILITY
0.0/ 100
METRIC RATING
326th/ 347
METRIC RANK
11.8%
FEMALE DISABILITY
95.6/ 100
METRIC RATING
128th/ 347
METRIC RANK
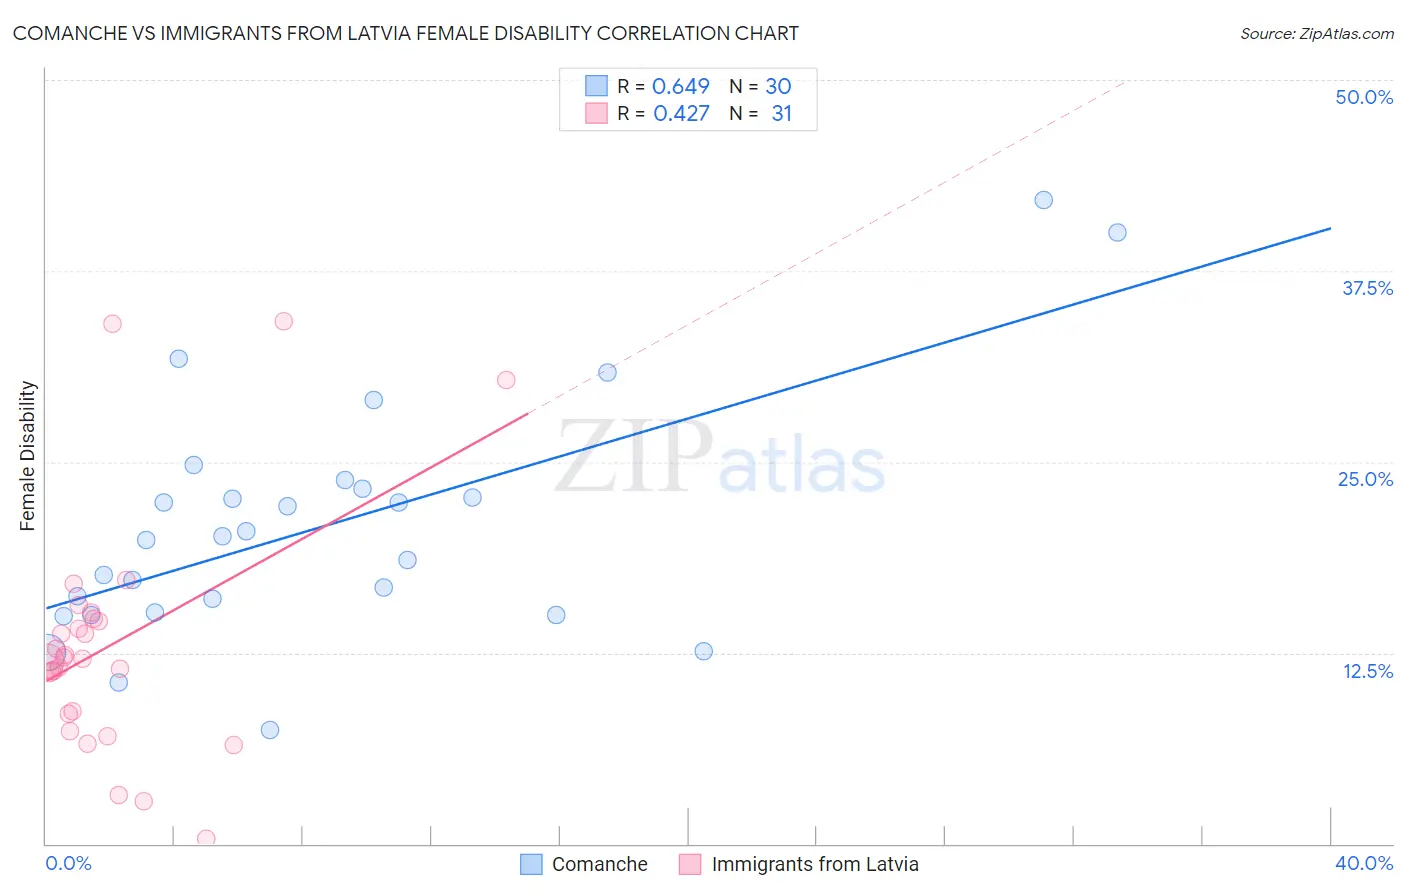
Comanche vs Immigrants from Latvia Female Disability Correlation Chart
The statistical analysis conducted on geographies consisting of 109,776,573 people shows a significant positive correlation between the proportion of Comanche and percentage of females with a disability in the United States with a correlation coefficient (R) of 0.649 and weighted average of 14.2%. Similarly, the statistical analysis conducted on geographies consisting of 113,739,259 people shows a moderate positive correlation between the proportion of Immigrants from Latvia and percentage of females with a disability in the United States with a correlation coefficient (R) of 0.427 and weighted average of 11.8%, a difference of 19.7%.
Female Disability Correlation Summary
| Measurement | Comanche | Immigrants from Latvia |
| Minimum | 7.4% | 0.34% |
| Maximum | 42.1% | 34.2% |
| Range | 34.7% | 33.8% |
| Mean | 20.8% | 13.0% |
| Median | 20.0% | 12.1% |
| Interquartile 25% (IQ1) | 15.1% | 8.5% |
| Interquartile 75% (IQ3) | 23.2% | 14.7% |
| Interquartile Range (IQR) | 8.1% | 6.2% |
| Standard Deviation (Sample) | 7.9% | 7.8% |
| Standard Deviation (Population) | 7.7% | 7.6% |
Similar Demographics by Female Disability
Demographics Similar to Comanche by Female Disability
In terms of female disability, the demographic groups most similar to Comanche are Navajo (14.2%, a difference of 0.11%), Native/Alaskan (14.1%, a difference of 0.25%), Black/African American (14.1%, a difference of 0.27%), Pueblo (14.1%, a difference of 0.43%), and Potawatomi (14.1%, a difference of 0.44%).
| Demographics | Rating | Rank | Female Disability |
| Iroquois | 0.0 /100 | #319 | Tragic 14.0% |
| Americans | 0.0 /100 | #320 | Tragic 14.1% |
| Potawatomi | 0.0 /100 | #321 | Tragic 14.1% |
| Pueblo | 0.0 /100 | #322 | Tragic 14.1% |
| Blacks/African Americans | 0.0 /100 | #323 | Tragic 14.1% |
| Natives/Alaskans | 0.0 /100 | #324 | Tragic 14.1% |
| Navajo | 0.0 /100 | #325 | Tragic 14.2% |
| Comanche | 0.0 /100 | #326 | Tragic 14.2% |
| Ottawa | 0.0 /100 | #327 | Tragic 14.2% |
| Cape Verdeans | 0.0 /100 | #328 | Tragic 14.2% |
| Osage | 0.0 /100 | #329 | Tragic 14.3% |
| Yuman | 0.0 /100 | #330 | Tragic 14.5% |
| Immigrants | Cabo Verde | 0.0 /100 | #331 | Tragic 14.6% |
| Pima | 0.0 /100 | #332 | Tragic 14.8% |
| Immigrants | Azores | 0.0 /100 | #333 | Tragic 14.9% |
Demographics Similar to Immigrants from Latvia by Female Disability
In terms of female disability, the demographic groups most similar to Immigrants from Latvia are Macedonian (11.8%, a difference of 0.030%), South American Indian (11.8%, a difference of 0.040%), Nicaraguan (11.9%, a difference of 0.090%), Arab (11.9%, a difference of 0.12%), and Immigrants from Europe (11.8%, a difference of 0.14%).
| Demographics | Rating | Rank | Female Disability |
| Immigrants | Netherlands | 96.9 /100 | #121 | Exceptional 11.8% |
| Immigrants | North Macedonia | 96.8 /100 | #122 | Exceptional 11.8% |
| Immigrants | Croatia | 96.7 /100 | #123 | Exceptional 11.8% |
| Russians | 96.5 /100 | #124 | Exceptional 11.8% |
| Immigrants | Italy | 96.4 /100 | #125 | Exceptional 11.8% |
| Immigrants | Europe | 96.2 /100 | #126 | Exceptional 11.8% |
| South American Indians | 95.8 /100 | #127 | Exceptional 11.8% |
| Immigrants | Latvia | 95.6 /100 | #128 | Exceptional 11.8% |
| Macedonians | 95.5 /100 | #129 | Exceptional 11.8% |
| Nicaraguans | 95.2 /100 | #130 | Exceptional 11.9% |
| Arabs | 95.1 /100 | #131 | Exceptional 11.9% |
| Immigrants | Syria | 94.6 /100 | #132 | Exceptional 11.9% |
| Kenyans | 94.5 /100 | #133 | Exceptional 11.9% |
| Immigrants | Nicaragua | 94.5 /100 | #134 | Exceptional 11.9% |
| Central Americans | 94.2 /100 | #135 | Exceptional 11.9% |