Sudanese vs Immigrants from Latvia Female Disability
COMPARE
Sudanese
Immigrants from Latvia
Female Disability
Female Disability Comparison
Sudanese
Immigrants from Latvia
12.0%
FEMALE DISABILITY
79.1/ 100
METRIC RATING
153rd/ 347
METRIC RANK
11.8%
FEMALE DISABILITY
95.6/ 100
METRIC RATING
128th/ 347
METRIC RANK
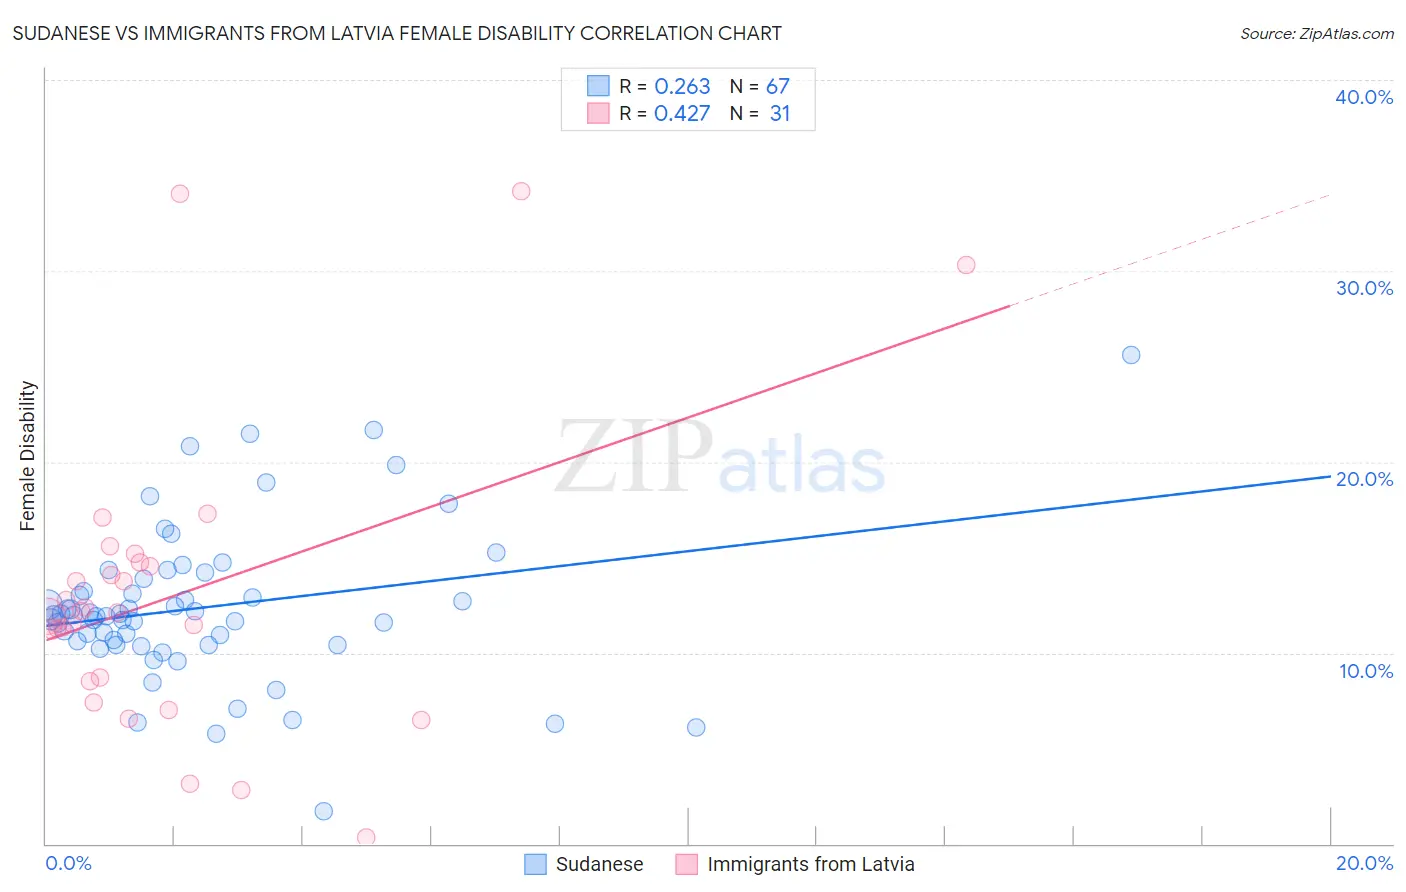
Sudanese vs Immigrants from Latvia Female Disability Correlation Chart
The statistical analysis conducted on geographies consisting of 110,131,007 people shows a weak positive correlation between the proportion of Sudanese and percentage of females with a disability in the United States with a correlation coefficient (R) of 0.263 and weighted average of 12.0%. Similarly, the statistical analysis conducted on geographies consisting of 113,739,259 people shows a moderate positive correlation between the proportion of Immigrants from Latvia and percentage of females with a disability in the United States with a correlation coefficient (R) of 0.427 and weighted average of 11.8%, a difference of 1.7%.
Female Disability Correlation Summary
| Measurement | Sudanese | Immigrants from Latvia |
| Minimum | 1.7% | 0.34% |
| Maximum | 25.6% | 34.2% |
| Range | 23.9% | 33.8% |
| Mean | 12.4% | 13.0% |
| Median | 12.0% | 12.1% |
| Interquartile 25% (IQ1) | 10.4% | 8.5% |
| Interquartile 75% (IQ3) | 13.9% | 14.7% |
| Interquartile Range (IQR) | 3.5% | 6.2% |
| Standard Deviation (Sample) | 4.0% | 7.8% |
| Standard Deviation (Population) | 4.0% | 7.6% |
Similar Demographics by Female Disability
Demographics Similar to Sudanese by Female Disability
In terms of female disability, the demographic groups most similar to Sudanese are Immigrants from Scotland (12.0%, a difference of 0.010%), Icelander (12.0%, a difference of 0.090%), Syrian (12.1%, a difference of 0.13%), Immigrants from Moldova (12.0%, a difference of 0.14%), and Ghanaian (12.1%, a difference of 0.14%).
| Demographics | Rating | Rank | Female Disability |
| Pakistanis | 84.6 /100 | #146 | Excellent 12.0% |
| Nigerians | 84.0 /100 | #147 | Excellent 12.0% |
| Immigrants | Kenya | 83.1 /100 | #148 | Excellent 12.0% |
| Greeks | 82.0 /100 | #149 | Excellent 12.0% |
| Immigrants | Moldova | 81.4 /100 | #150 | Excellent 12.0% |
| Icelanders | 80.7 /100 | #151 | Excellent 12.0% |
| Immigrants | Scotland | 79.3 /100 | #152 | Good 12.0% |
| Sudanese | 79.1 /100 | #153 | Good 12.0% |
| Syrians | 76.9 /100 | #154 | Good 12.1% |
| Ghanaians | 76.6 /100 | #155 | Good 12.1% |
| Moroccans | 72.9 /100 | #156 | Good 12.1% |
| Danes | 72.5 /100 | #157 | Good 12.1% |
| Immigrants | Middle Africa | 72.4 /100 | #158 | Good 12.1% |
| Immigrants | Central America | 67.7 /100 | #159 | Good 12.1% |
| Immigrants | Guatemala | 66.0 /100 | #160 | Good 12.1% |
Demographics Similar to Immigrants from Latvia by Female Disability
In terms of female disability, the demographic groups most similar to Immigrants from Latvia are Macedonian (11.8%, a difference of 0.030%), South American Indian (11.8%, a difference of 0.040%), Nicaraguan (11.9%, a difference of 0.090%), Arab (11.9%, a difference of 0.12%), and Immigrants from Europe (11.8%, a difference of 0.14%).
| Demographics | Rating | Rank | Female Disability |
| Immigrants | Netherlands | 96.9 /100 | #121 | Exceptional 11.8% |
| Immigrants | North Macedonia | 96.8 /100 | #122 | Exceptional 11.8% |
| Immigrants | Croatia | 96.7 /100 | #123 | Exceptional 11.8% |
| Russians | 96.5 /100 | #124 | Exceptional 11.8% |
| Immigrants | Italy | 96.4 /100 | #125 | Exceptional 11.8% |
| Immigrants | Europe | 96.2 /100 | #126 | Exceptional 11.8% |
| South American Indians | 95.8 /100 | #127 | Exceptional 11.8% |
| Immigrants | Latvia | 95.6 /100 | #128 | Exceptional 11.8% |
| Macedonians | 95.5 /100 | #129 | Exceptional 11.8% |
| Nicaraguans | 95.2 /100 | #130 | Exceptional 11.9% |
| Arabs | 95.1 /100 | #131 | Exceptional 11.9% |
| Immigrants | Syria | 94.6 /100 | #132 | Exceptional 11.9% |
| Kenyans | 94.5 /100 | #133 | Exceptional 11.9% |
| Immigrants | Nicaragua | 94.5 /100 | #134 | Exceptional 11.9% |
| Central Americans | 94.2 /100 | #135 | Exceptional 11.9% |