Comanche vs Immigrants from Latvia In Labor Force | Age 35-44
COMPARE
Comanche
Immigrants from Latvia
In Labor Force | Age 35-44
In Labor Force | Age 35-44 Comparison
Comanche
Immigrants from Latvia
81.5%
IN LABOR FORCE | AGE 35-44
0.0/ 100
METRIC RATING
316th/ 347
METRIC RANK
85.0%
IN LABOR FORCE | AGE 35-44
99.3/ 100
METRIC RATING
61st/ 347
METRIC RANK
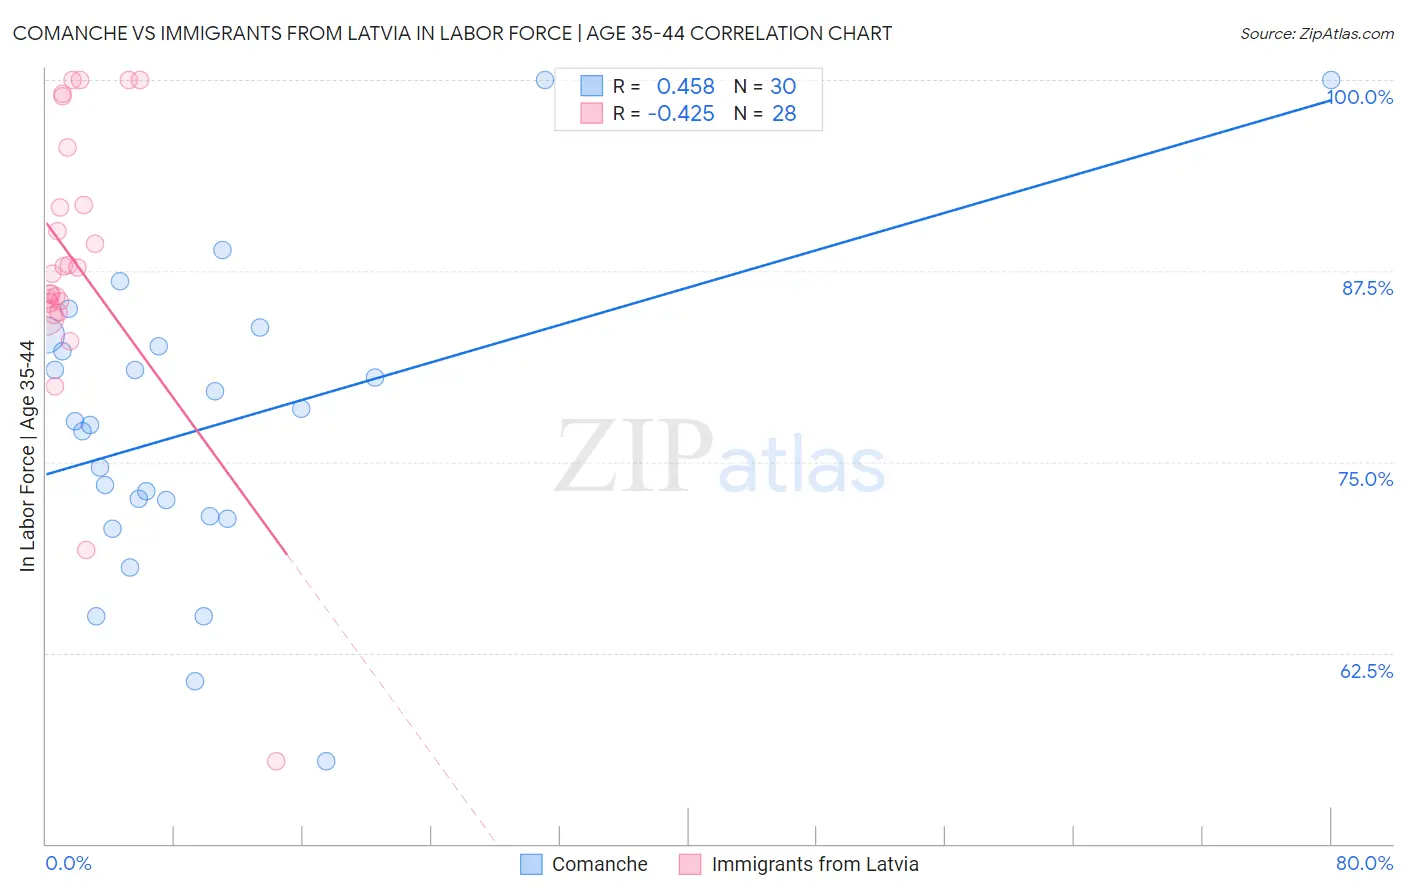
Comanche vs Immigrants from Latvia In Labor Force | Age 35-44 Correlation Chart
The statistical analysis conducted on geographies consisting of 109,773,192 people shows a moderate positive correlation between the proportion of Comanche and labor force participation rate among population between the ages 35 and 44 in the United States with a correlation coefficient (R) of 0.458 and weighted average of 81.5%. Similarly, the statistical analysis conducted on geographies consisting of 113,724,551 people shows a moderate negative correlation between the proportion of Immigrants from Latvia and labor force participation rate among population between the ages 35 and 44 in the United States with a correlation coefficient (R) of -0.425 and weighted average of 85.0%, a difference of 4.4%.
In Labor Force | Age 35-44 Correlation Summary
| Measurement | Comanche | Immigrants from Latvia |
| Minimum | 55.4% | 55.4% |
| Maximum | 100.0% | 100.0% |
| Range | 44.6% | 44.6% |
| Mean | 77.3% | 88.0% |
| Median | 77.6% | 87.6% |
| Interquartile 25% (IQ1) | 71.4% | 85.1% |
| Interquartile 75% (IQ3) | 82.6% | 93.7% |
| Interquartile Range (IQR) | 11.2% | 8.6% |
| Standard Deviation (Sample) | 9.9% | 9.6% |
| Standard Deviation (Population) | 9.7% | 9.4% |
Similar Demographics by In Labor Force | Age 35-44
Demographics Similar to Comanche by In Labor Force | Age 35-44
In terms of in labor force | age 35-44, the demographic groups most similar to Comanche are Immigrants from Mexico (81.5%, a difference of 0.020%), Cajun (81.5%, a difference of 0.050%), Cherokee (81.4%, a difference of 0.080%), Alaska Native (81.6%, a difference of 0.16%), and Mexican (81.6%, a difference of 0.16%).
| Demographics | Rating | Rank | In Labor Force | Age 35-44 |
| Cree | 0.0 /100 | #309 | Tragic 82.0% |
| Blackfeet | 0.0 /100 | #310 | Tragic 81.9% |
| Colville | 0.0 /100 | #311 | Tragic 81.7% |
| Alaska Natives | 0.0 /100 | #312 | Tragic 81.6% |
| Mexicans | 0.0 /100 | #313 | Tragic 81.6% |
| Cajuns | 0.0 /100 | #314 | Tragic 81.5% |
| Immigrants | Mexico | 0.0 /100 | #315 | Tragic 81.5% |
| Comanche | 0.0 /100 | #316 | Tragic 81.5% |
| Cherokee | 0.0 /100 | #317 | Tragic 81.4% |
| Alaskan Athabascans | 0.0 /100 | #318 | Tragic 81.3% |
| Inupiat | 0.0 /100 | #319 | Tragic 80.9% |
| Chickasaw | 0.0 /100 | #320 | Tragic 80.9% |
| Puerto Ricans | 0.0 /100 | #321 | Tragic 80.7% |
| Paiute | 0.0 /100 | #322 | Tragic 80.6% |
| Yaqui | 0.0 /100 | #323 | Tragic 80.5% |
Demographics Similar to Immigrants from Latvia by In Labor Force | Age 35-44
In terms of in labor force | age 35-44, the demographic groups most similar to Immigrants from Latvia are Immigrants from Moldova (85.0%, a difference of 0.010%), Immigrants from Uganda (85.0%, a difference of 0.010%), Slovak (85.1%, a difference of 0.020%), Serbian (85.1%, a difference of 0.020%), and Albanian (85.1%, a difference of 0.020%).
| Demographics | Rating | Rank | In Labor Force | Age 35-44 |
| Turks | 99.5 /100 | #54 | Exceptional 85.1% |
| Soviet Union | 99.5 /100 | #55 | Exceptional 85.1% |
| Immigrants | Croatia | 99.5 /100 | #56 | Exceptional 85.1% |
| Chinese | 99.4 /100 | #57 | Exceptional 85.1% |
| Slovaks | 99.4 /100 | #58 | Exceptional 85.1% |
| Serbians | 99.4 /100 | #59 | Exceptional 85.1% |
| Albanians | 99.4 /100 | #60 | Exceptional 85.1% |
| Immigrants | Latvia | 99.3 /100 | #61 | Exceptional 85.0% |
| Immigrants | Moldova | 99.3 /100 | #62 | Exceptional 85.0% |
| Immigrants | Uganda | 99.3 /100 | #63 | Exceptional 85.0% |
| Swedes | 99.2 /100 | #64 | Exceptional 85.0% |
| Immigrants | Brazil | 99.2 /100 | #65 | Exceptional 85.0% |
| Immigrants | Haiti | 99.1 /100 | #66 | Exceptional 85.0% |
| Immigrants | Italy | 99.1 /100 | #67 | Exceptional 85.0% |
| Italians | 99.1 /100 | #68 | Exceptional 85.0% |