Immigrants from Northern Africa vs Immigrants from Latvia Female Disability
COMPARE
Immigrants from Northern Africa
Immigrants from Latvia
Female Disability
Female Disability Comparison
Immigrants from Northern Africa
Immigrants from Latvia
11.5%
FEMALE DISABILITY
99.8/ 100
METRIC RATING
68th/ 347
METRIC RANK
11.8%
FEMALE DISABILITY
95.6/ 100
METRIC RATING
128th/ 347
METRIC RANK
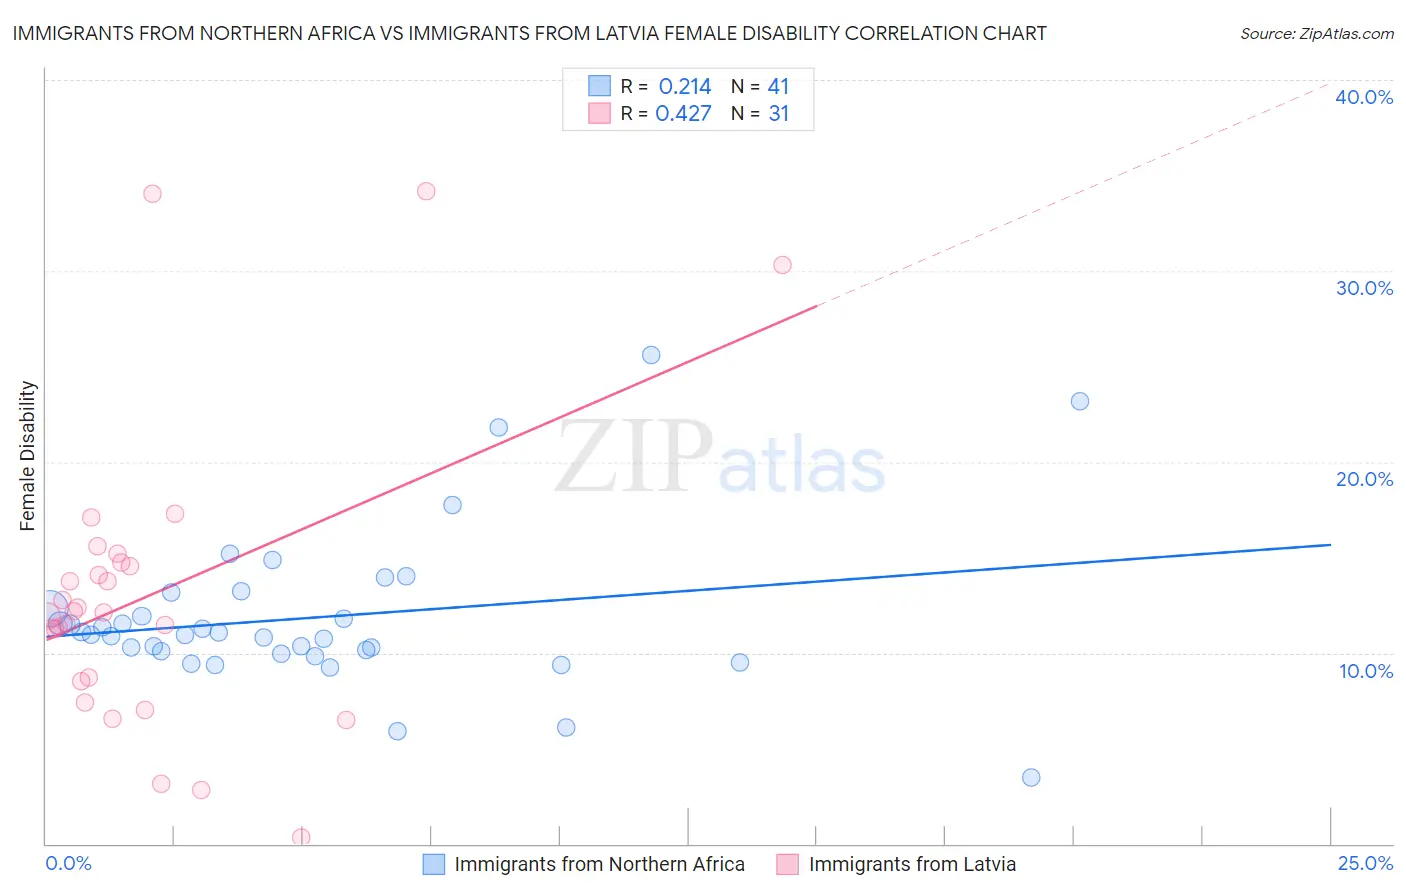
Immigrants from Northern Africa vs Immigrants from Latvia Female Disability Correlation Chart
The statistical analysis conducted on geographies consisting of 321,175,054 people shows a weak positive correlation between the proportion of Immigrants from Northern Africa and percentage of females with a disability in the United States with a correlation coefficient (R) of 0.214 and weighted average of 11.5%. Similarly, the statistical analysis conducted on geographies consisting of 113,739,259 people shows a moderate positive correlation between the proportion of Immigrants from Latvia and percentage of females with a disability in the United States with a correlation coefficient (R) of 0.427 and weighted average of 11.8%, a difference of 3.3%.
Female Disability Correlation Summary
| Measurement | Immigrants from Northern Africa | Immigrants from Latvia |
| Minimum | 3.5% | 0.34% |
| Maximum | 25.6% | 34.2% |
| Range | 22.1% | 33.8% |
| Mean | 11.8% | 13.0% |
| Median | 10.9% | 12.1% |
| Interquartile 25% (IQ1) | 10.0% | 8.5% |
| Interquartile 75% (IQ3) | 12.7% | 14.7% |
| Interquartile Range (IQR) | 2.7% | 6.2% |
| Standard Deviation (Sample) | 4.1% | 7.8% |
| Standard Deviation (Population) | 4.1% | 7.6% |
Similar Demographics by Female Disability
Demographics Similar to Immigrants from Northern Africa by Female Disability
In terms of female disability, the demographic groups most similar to Immigrants from Northern Africa are Immigrants from Vietnam (11.5%, a difference of 0.020%), Salvadoran (11.5%, a difference of 0.060%), Colombian (11.5%, a difference of 0.070%), Immigrants from Chile (11.5%, a difference of 0.080%), and Immigrants from Ireland (11.5%, a difference of 0.13%).
| Demographics | Rating | Rank | Female Disability |
| Immigrants | France | 99.9 /100 | #61 | Exceptional 11.4% |
| Sri Lankans | 99.9 /100 | #62 | Exceptional 11.4% |
| Immigrants | Colombia | 99.9 /100 | #63 | Exceptional 11.4% |
| Immigrants | El Salvador | 99.9 /100 | #64 | Exceptional 11.4% |
| Immigrants | South America | 99.9 /100 | #65 | Exceptional 11.4% |
| Salvadorans | 99.8 /100 | #66 | Exceptional 11.5% |
| Immigrants | Vietnam | 99.8 /100 | #67 | Exceptional 11.5% |
| Immigrants | Northern Africa | 99.8 /100 | #68 | Exceptional 11.5% |
| Colombians | 99.8 /100 | #69 | Exceptional 11.5% |
| Immigrants | Chile | 99.8 /100 | #70 | Exceptional 11.5% |
| Immigrants | Ireland | 99.8 /100 | #71 | Exceptional 11.5% |
| Chileans | 99.8 /100 | #72 | Exceptional 11.5% |
| Immigrants | Switzerland | 99.8 /100 | #73 | Exceptional 11.5% |
| Bhutanese | 99.8 /100 | #74 | Exceptional 11.5% |
| Immigrants | Lebanon | 99.7 /100 | #75 | Exceptional 11.5% |
Demographics Similar to Immigrants from Latvia by Female Disability
In terms of female disability, the demographic groups most similar to Immigrants from Latvia are Macedonian (11.8%, a difference of 0.030%), South American Indian (11.8%, a difference of 0.040%), Nicaraguan (11.9%, a difference of 0.090%), Arab (11.9%, a difference of 0.12%), and Immigrants from Europe (11.8%, a difference of 0.14%).
| Demographics | Rating | Rank | Female Disability |
| Immigrants | Netherlands | 96.9 /100 | #121 | Exceptional 11.8% |
| Immigrants | North Macedonia | 96.8 /100 | #122 | Exceptional 11.8% |
| Immigrants | Croatia | 96.7 /100 | #123 | Exceptional 11.8% |
| Russians | 96.5 /100 | #124 | Exceptional 11.8% |
| Immigrants | Italy | 96.4 /100 | #125 | Exceptional 11.8% |
| Immigrants | Europe | 96.2 /100 | #126 | Exceptional 11.8% |
| South American Indians | 95.8 /100 | #127 | Exceptional 11.8% |
| Immigrants | Latvia | 95.6 /100 | #128 | Exceptional 11.8% |
| Macedonians | 95.5 /100 | #129 | Exceptional 11.8% |
| Nicaraguans | 95.2 /100 | #130 | Exceptional 11.9% |
| Arabs | 95.1 /100 | #131 | Exceptional 11.9% |
| Immigrants | Syria | 94.6 /100 | #132 | Exceptional 11.9% |
| Kenyans | 94.5 /100 | #133 | Exceptional 11.9% |
| Immigrants | Nicaragua | 94.5 /100 | #134 | Exceptional 11.9% |
| Central Americans | 94.2 /100 | #135 | Exceptional 11.9% |