Chinese vs Immigrants from El Salvador Cognitive Disability
COMPARE
Chinese
Immigrants from El Salvador
Cognitive Disability
Cognitive Disability Comparison
Chinese
Immigrants from El Salvador
15.9%
COGNITIVE DISABILITY
100.0/ 100
METRIC RATING
3rd/ 347
METRIC RANK
17.6%
COGNITIVE DISABILITY
7.0/ 100
METRIC RATING
214th/ 347
METRIC RANK
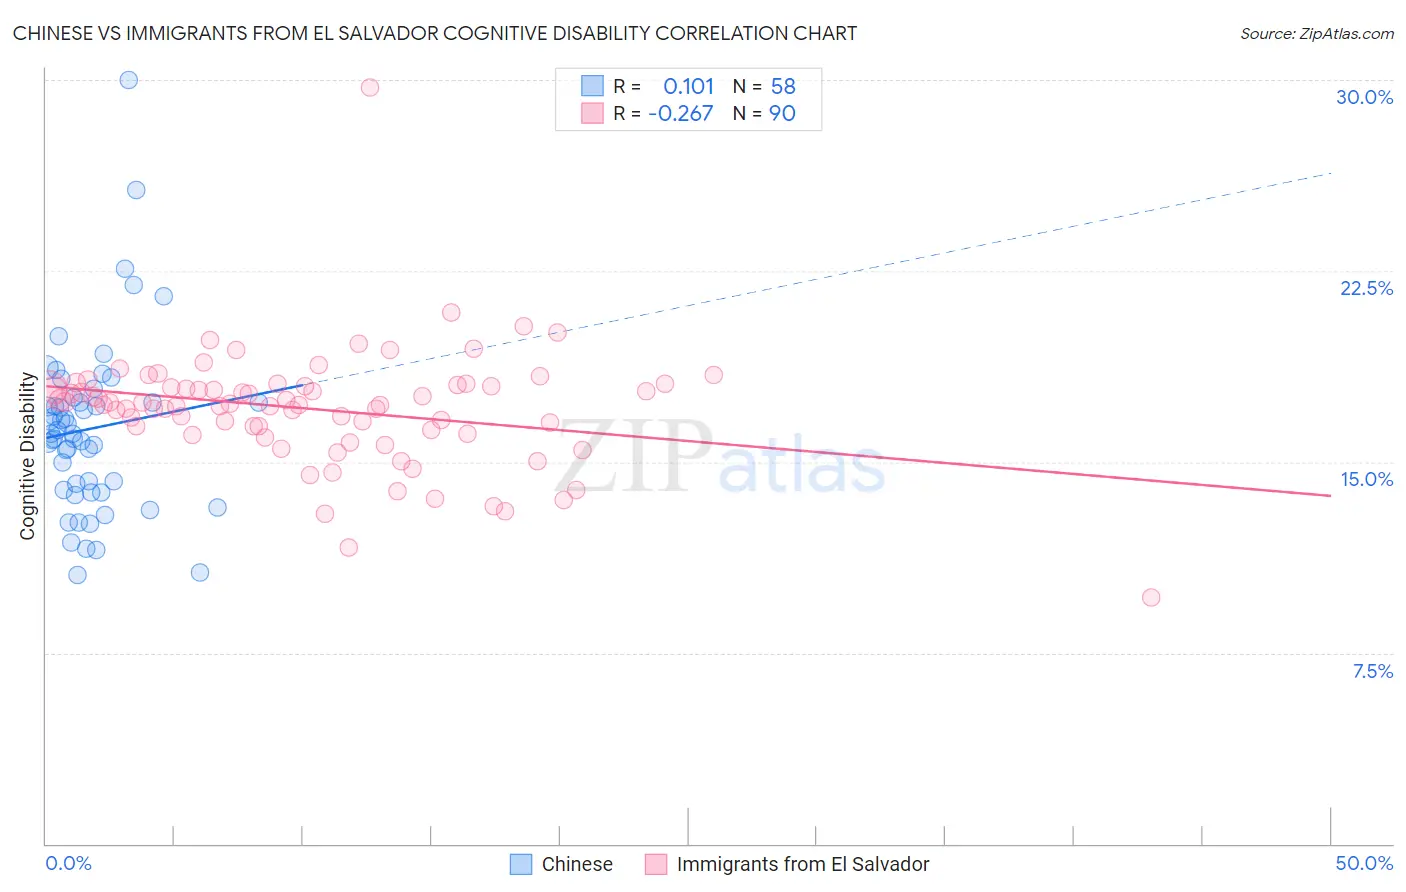
Chinese vs Immigrants from El Salvador Cognitive Disability Correlation Chart
The statistical analysis conducted on geographies consisting of 64,802,428 people shows a poor positive correlation between the proportion of Chinese and percentage of population with cognitive disability in the United States with a correlation coefficient (R) of 0.101 and weighted average of 15.9%. Similarly, the statistical analysis conducted on geographies consisting of 357,776,570 people shows a weak negative correlation between the proportion of Immigrants from El Salvador and percentage of population with cognitive disability in the United States with a correlation coefficient (R) of -0.267 and weighted average of 17.6%, a difference of 10.5%.
Cognitive Disability Correlation Summary
| Measurement | Chinese | Immigrants from El Salvador |
| Minimum | 10.5% | 9.6% |
| Maximum | 30.0% | 29.7% |
| Range | 19.5% | 20.0% |
| Mean | 16.3% | 17.1% |
| Median | 16.1% | 17.3% |
| Interquartile 25% (IQ1) | 13.9% | 16.2% |
| Interquartile 75% (IQ3) | 17.3% | 18.0% |
| Interquartile Range (IQR) | 3.4% | 1.7% |
| Standard Deviation (Sample) | 3.4% | 2.3% |
| Standard Deviation (Population) | 3.4% | 2.3% |
Similar Demographics by Cognitive Disability
Demographics Similar to Chinese by Cognitive Disability
In terms of cognitive disability, the demographic groups most similar to Chinese are Immigrants from India (15.9%, a difference of 0.080%), Immigrants from Lithuania (16.0%, a difference of 0.18%), Immigrants from Hong Kong (16.0%, a difference of 0.59%), Thai (16.1%, a difference of 1.2%), and Immigrants from Ireland (16.1%, a difference of 1.3%).
| Demographics | Rating | Rank | Cognitive Disability |
| Immigrants | Taiwan | 100.0 /100 | #1 | Exceptional 15.7% |
| Immigrants | India | 100.0 /100 | #2 | Exceptional 15.9% |
| Chinese | 100.0 /100 | #3 | Exceptional 15.9% |
| Immigrants | Lithuania | 100.0 /100 | #4 | Exceptional 16.0% |
| Immigrants | Hong Kong | 100.0 /100 | #5 | Exceptional 16.0% |
| Thais | 100.0 /100 | #6 | Exceptional 16.1% |
| Immigrants | Ireland | 100.0 /100 | #7 | Exceptional 16.1% |
| Immigrants | Poland | 100.0 /100 | #8 | Exceptional 16.1% |
| Assyrians/Chaldeans/Syriacs | 100.0 /100 | #9 | Exceptional 16.2% |
| Immigrants | Scotland | 100.0 /100 | #10 | Exceptional 16.2% |
| Immigrants | Czechoslovakia | 100.0 /100 | #11 | Exceptional 16.2% |
| Maltese | 100.0 /100 | #12 | Exceptional 16.2% |
| Lithuanians | 100.0 /100 | #13 | Exceptional 16.3% |
| Immigrants | Austria | 100.0 /100 | #14 | Exceptional 16.3% |
| Immigrants | Greece | 100.0 /100 | #15 | Exceptional 16.3% |
Demographics Similar to Immigrants from El Salvador by Cognitive Disability
In terms of cognitive disability, the demographic groups most similar to Immigrants from El Salvador are Alaskan Athabascan (17.6%, a difference of 0.010%), Hawaiian (17.6%, a difference of 0.020%), Okinawan (17.6%, a difference of 0.020%), Salvadoran (17.6%, a difference of 0.030%), and Immigrants from Oceania (17.6%, a difference of 0.040%).
| Demographics | Rating | Rank | Cognitive Disability |
| Immigrants | Latin America | 9.7 /100 | #207 | Tragic 17.6% |
| Immigrants | Cameroon | 9.3 /100 | #208 | Tragic 17.6% |
| Immigrants | Trinidad and Tobago | 8.7 /100 | #209 | Tragic 17.6% |
| Immigrants | Jamaica | 8.5 /100 | #210 | Tragic 17.6% |
| Taiwanese | 7.7 /100 | #211 | Tragic 17.6% |
| Immigrants | Oceania | 7.3 /100 | #212 | Tragic 17.6% |
| Hawaiians | 7.2 /100 | #213 | Tragic 17.6% |
| Immigrants | El Salvador | 7.0 /100 | #214 | Tragic 17.6% |
| Alaskan Athabascans | 6.9 /100 | #215 | Tragic 17.6% |
| Okinawans | 6.8 /100 | #216 | Tragic 17.6% |
| Salvadorans | 6.7 /100 | #217 | Tragic 17.6% |
| Icelanders | 6.4 /100 | #218 | Tragic 17.6% |
| Immigrants | Sierra Leone | 6.3 /100 | #219 | Tragic 17.6% |
| Zimbabweans | 6.1 /100 | #220 | Tragic 17.6% |
| Moroccans | 5.9 /100 | #221 | Tragic 17.6% |