Spanish American Indian vs Delaware Cognitive Disability
COMPARE
Spanish American Indian
Delaware
Cognitive Disability
Cognitive Disability Comparison
Spanish American Indians
Delaware
17.8%
COGNITIVE DISABILITY
2.0/ 100
METRIC RATING
235th/ 347
METRIC RANK
17.4%
COGNITIVE DISABILITY
25.6/ 100
METRIC RATING
193rd/ 347
METRIC RANK
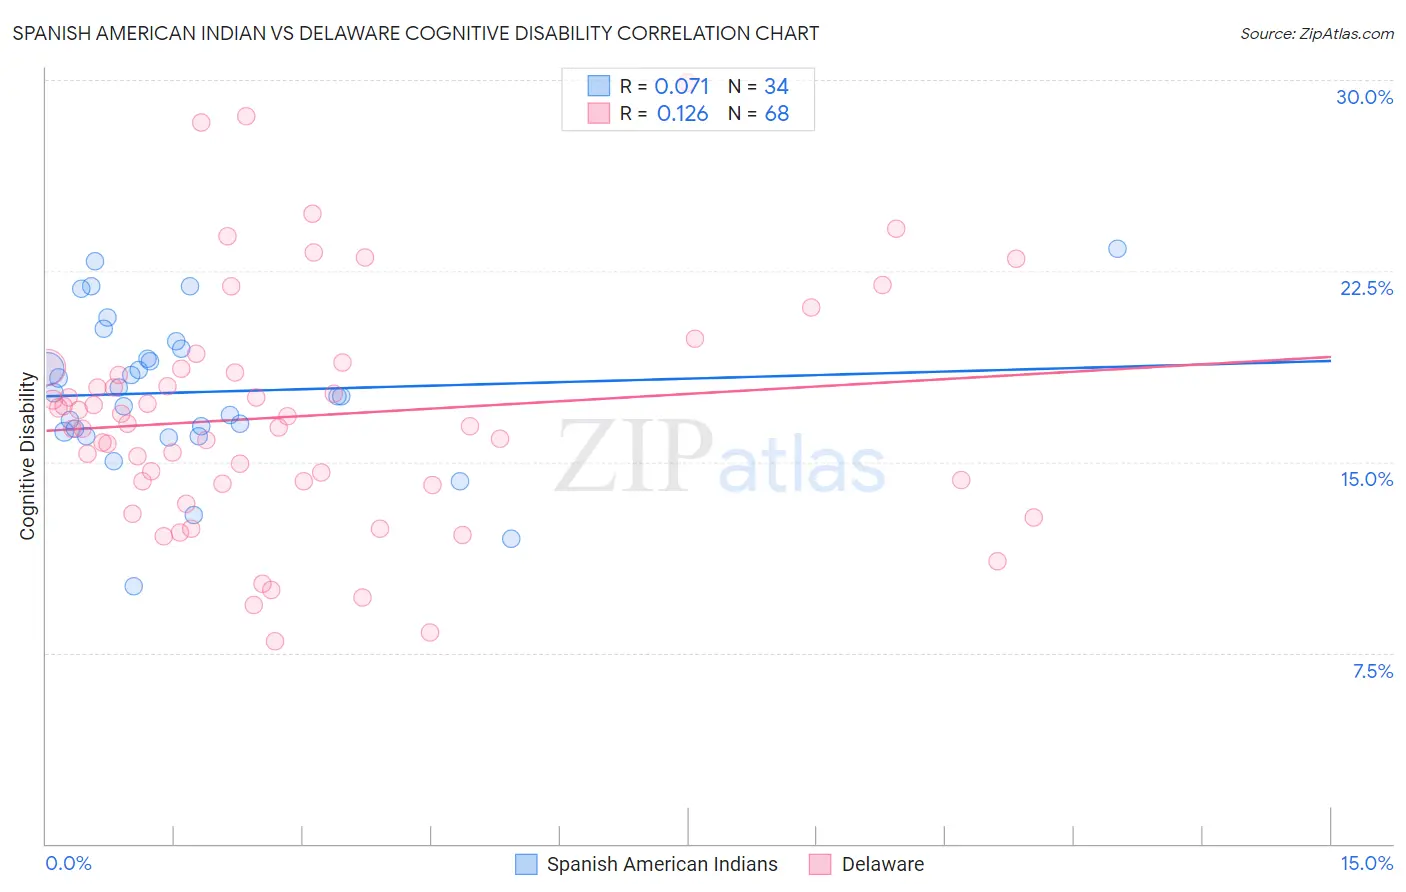
Spanish American Indian vs Delaware Cognitive Disability Correlation Chart
The statistical analysis conducted on geographies consisting of 73,150,113 people shows a slight positive correlation between the proportion of Spanish American Indians and percentage of population with cognitive disability in the United States with a correlation coefficient (R) of 0.071 and weighted average of 17.8%. Similarly, the statistical analysis conducted on geographies consisting of 96,240,838 people shows a poor positive correlation between the proportion of Delaware and percentage of population with cognitive disability in the United States with a correlation coefficient (R) of 0.126 and weighted average of 17.4%, a difference of 2.0%.
Cognitive Disability Correlation Summary
| Measurement | Spanish American Indian | Delaware |
| Minimum | 10.1% | 8.0% |
| Maximum | 23.4% | 29.9% |
| Range | 13.2% | 21.9% |
| Mean | 17.7% | 16.8% |
| Median | 17.6% | 16.5% |
| Interquartile 25% (IQ1) | 16.2% | 14.2% |
| Interquartile 75% (IQ3) | 19.4% | 18.6% |
| Interquartile Range (IQR) | 3.3% | 4.4% |
| Standard Deviation (Sample) | 3.0% | 4.6% |
| Standard Deviation (Population) | 2.9% | 4.6% |
Similar Demographics by Cognitive Disability
Demographics Similar to Spanish American Indians by Cognitive Disability
In terms of cognitive disability, the demographic groups most similar to Spanish American Indians are Osage (17.8%, a difference of 0.0%), Guatemalan (17.8%, a difference of 0.020%), Tongan (17.8%, a difference of 0.020%), Panamanian (17.8%, a difference of 0.020%), and Mongolian (17.7%, a difference of 0.060%).
| Demographics | Rating | Rank | Cognitive Disability |
| Immigrants | Central America | 2.3 /100 | #228 | Tragic 17.7% |
| Immigrants | Guatemala | 2.2 /100 | #229 | Tragic 17.7% |
| Mongolians | 2.2 /100 | #230 | Tragic 17.7% |
| Guatemalans | 2.1 /100 | #231 | Tragic 17.8% |
| Tongans | 2.1 /100 | #232 | Tragic 17.8% |
| Panamanians | 2.1 /100 | #233 | Tragic 17.8% |
| Osage | 2.0 /100 | #234 | Tragic 17.8% |
| Spanish American Indians | 2.0 /100 | #235 | Tragic 17.8% |
| Immigrants | Iraq | 1.8 /100 | #236 | Tragic 17.8% |
| Immigrants | Mexico | 1.8 /100 | #237 | Tragic 17.8% |
| Cheyenne | 1.7 /100 | #238 | Tragic 17.8% |
| Cajuns | 1.4 /100 | #239 | Tragic 17.8% |
| Iraqis | 1.4 /100 | #240 | Tragic 17.8% |
| Mexicans | 1.1 /100 | #241 | Tragic 17.8% |
| Paiute | 1.1 /100 | #242 | Tragic 17.8% |
Demographics Similar to Delaware by Cognitive Disability
In terms of cognitive disability, the demographic groups most similar to Delaware are Immigrants from Haiti (17.4%, a difference of 0.050%), Nonimmigrants (17.4%, a difference of 0.060%), Immigrants from Spain (17.4%, a difference of 0.070%), Immigrants from Western Asia (17.4%, a difference of 0.14%), and Immigrants from Bosnia and Herzegovina (17.4%, a difference of 0.14%).
| Demographics | Rating | Rank | Cognitive Disability |
| Cambodians | 35.9 /100 | #186 | Fair 17.3% |
| Immigrants | Fiji | 33.7 /100 | #187 | Fair 17.4% |
| Immigrants | France | 29.8 /100 | #188 | Fair 17.4% |
| Immigrants | Western Asia | 29.5 /100 | #189 | Fair 17.4% |
| Immigrants | Spain | 27.7 /100 | #190 | Fair 17.4% |
| Immigrants | Nonimmigrants | 27.4 /100 | #191 | Fair 17.4% |
| Immigrants | Haiti | 27.1 /100 | #192 | Fair 17.4% |
| Delaware | 25.6 /100 | #193 | Fair 17.4% |
| Immigrants | Bosnia and Herzegovina | 22.0 /100 | #194 | Fair 17.4% |
| New Zealanders | 21.1 /100 | #195 | Fair 17.4% |
| Guyanese | 17.5 /100 | #196 | Poor 17.5% |
| Immigrants | Afghanistan | 16.7 /100 | #197 | Poor 17.5% |
| Immigrants | Panama | 14.8 /100 | #198 | Poor 17.5% |
| Immigrants | Singapore | 14.3 /100 | #199 | Poor 17.5% |
| Haitians | 14.1 /100 | #200 | Poor 17.5% |