Moroccan vs Immigrants from Trinidad and Tobago Ambulatory Disability
COMPARE
Moroccan
Immigrants from Trinidad and Tobago
Ambulatory Disability
Ambulatory Disability Comparison
Moroccans
Immigrants from Trinidad and Tobago
6.1%
AMBULATORY DISABILITY
52.6/ 100
METRIC RATING
171st/ 347
METRIC RANK
6.7%
AMBULATORY DISABILITY
0.1/ 100
METRIC RATING
271st/ 347
METRIC RANK
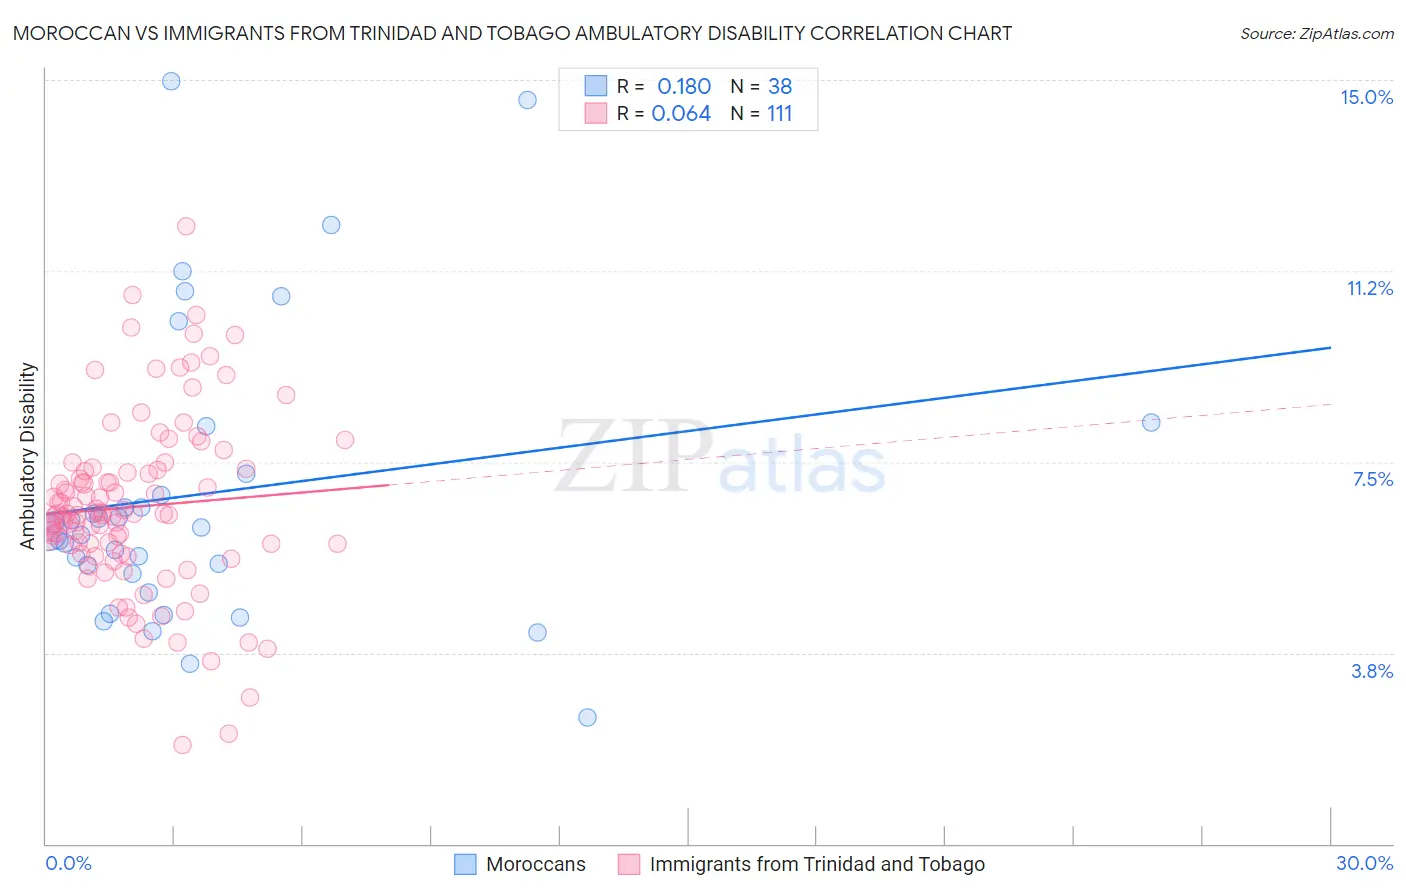
Moroccan vs Immigrants from Trinidad and Tobago Ambulatory Disability Correlation Chart
The statistical analysis conducted on geographies consisting of 201,789,132 people shows a poor positive correlation between the proportion of Moroccans and percentage of population with ambulatory disability in the United States with a correlation coefficient (R) of 0.180 and weighted average of 6.1%. Similarly, the statistical analysis conducted on geographies consisting of 223,483,943 people shows a slight positive correlation between the proportion of Immigrants from Trinidad and Tobago and percentage of population with ambulatory disability in the United States with a correlation coefficient (R) of 0.064 and weighted average of 6.7%, a difference of 9.1%.
Ambulatory Disability Correlation Summary
| Measurement | Moroccan | Immigrants from Trinidad and Tobago |
| Minimum | 2.5% | 1.9% |
| Maximum | 15.0% | 12.1% |
| Range | 12.5% | 10.2% |
| Mean | 6.9% | 6.6% |
| Median | 6.2% | 6.5% |
| Interquartile 25% (IQ1) | 5.3% | 5.7% |
| Interquartile 75% (IQ3) | 7.3% | 7.3% |
| Interquartile Range (IQR) | 2.0% | 1.6% |
| Standard Deviation (Sample) | 2.9% | 1.7% |
| Standard Deviation (Population) | 2.8% | 1.7% |
Similar Demographics by Ambulatory Disability
Demographics Similar to Moroccans by Ambulatory Disability
In terms of ambulatory disability, the demographic groups most similar to Moroccans are Immigrants from Burma/Myanmar (6.1%, a difference of 0.020%), Immigrants from Ecuador (6.1%, a difference of 0.070%), Croatian (6.1%, a difference of 0.080%), Immigrants from Canada (6.1%, a difference of 0.14%), and Immigrants from Southern Europe (6.1%, a difference of 0.29%).
| Demographics | Rating | Rank | Ambulatory Disability |
| Basques | 63.7 /100 | #164 | Good 6.1% |
| Nicaraguans | 63.2 /100 | #165 | Good 6.1% |
| Iraqis | 62.8 /100 | #166 | Good 6.1% |
| Immigrants | Oceania | 60.7 /100 | #167 | Good 6.1% |
| Ecuadorians | 60.5 /100 | #168 | Good 6.1% |
| Immigrants | Southern Europe | 58.1 /100 | #169 | Average 6.1% |
| Immigrants | Ecuador | 53.8 /100 | #170 | Average 6.1% |
| Moroccans | 52.6 /100 | #171 | Average 6.1% |
| Immigrants | Burma/Myanmar | 52.2 /100 | #172 | Average 6.1% |
| Croatians | 51.2 /100 | #173 | Average 6.1% |
| Immigrants | Canada | 50.0 /100 | #174 | Average 6.1% |
| Vietnamese | 47.2 /100 | #175 | Average 6.1% |
| Immigrants | North America | 45.6 /100 | #176 | Average 6.1% |
| Immigrants | England | 45.4 /100 | #177 | Average 6.1% |
| Scandinavians | 44.5 /100 | #178 | Average 6.1% |
Demographics Similar to Immigrants from Trinidad and Tobago by Ambulatory Disability
In terms of ambulatory disability, the demographic groups most similar to Immigrants from Trinidad and Tobago are Slovak (6.7%, a difference of 0.10%), French (6.6%, a difference of 0.26%), French Canadian (6.7%, a difference of 0.36%), White/Caucasian (6.7%, a difference of 0.38%), and Spanish (6.6%, a difference of 0.56%).
| Demographics | Rating | Rank | Ambulatory Disability |
| Nepalese | 0.2 /100 | #264 | Tragic 6.6% |
| Bahamians | 0.2 /100 | #265 | Tragic 6.6% |
| Guyanese | 0.2 /100 | #266 | Tragic 6.6% |
| Trinidadians and Tobagonians | 0.2 /100 | #267 | Tragic 6.6% |
| Spanish | 0.2 /100 | #268 | Tragic 6.6% |
| French | 0.1 /100 | #269 | Tragic 6.6% |
| Slovaks | 0.1 /100 | #270 | Tragic 6.7% |
| Immigrants | Trinidad and Tobago | 0.1 /100 | #271 | Tragic 6.7% |
| French Canadians | 0.1 /100 | #272 | Tragic 6.7% |
| Whites/Caucasians | 0.1 /100 | #273 | Tragic 6.7% |
| Sioux | 0.1 /100 | #274 | Tragic 6.7% |
| Immigrants | Guyana | 0.1 /100 | #275 | Tragic 6.7% |
| Celtics | 0.1 /100 | #276 | Tragic 6.7% |
| Jamaicans | 0.1 /100 | #277 | Tragic 6.7% |
| Immigrants | West Indies | 0.1 /100 | #278 | Tragic 6.7% |