Colombian vs Immigrants from Trinidad and Tobago 5th Grade
COMPARE
Colombian
Immigrants from Trinidad and Tobago
5th Grade
5th Grade Comparison
Colombians
Immigrants from Trinidad and Tobago
96.9%
5TH GRADE
1.3/ 100
METRIC RATING
245th/ 347
METRIC RANK
96.6%
5TH GRADE
0.1/ 100
METRIC RATING
284th/ 347
METRIC RANK
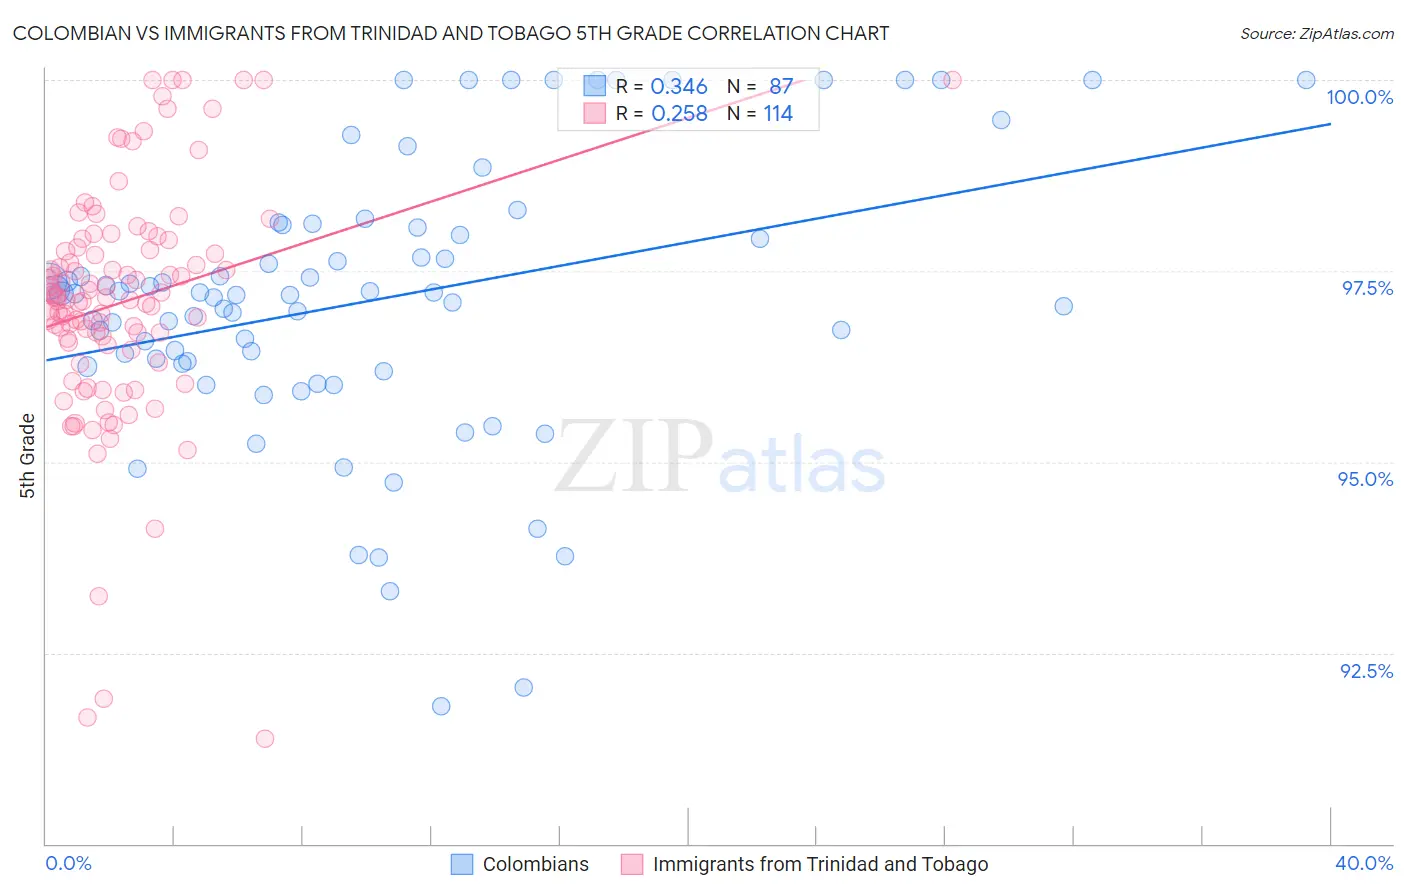
Colombian vs Immigrants from Trinidad and Tobago 5th Grade Correlation Chart
The statistical analysis conducted on geographies consisting of 419,701,178 people shows a mild positive correlation between the proportion of Colombians and percentage of population with at least 5th grade education in the United States with a correlation coefficient (R) of 0.346 and weighted average of 96.9%. Similarly, the statistical analysis conducted on geographies consisting of 223,526,834 people shows a weak positive correlation between the proportion of Immigrants from Trinidad and Tobago and percentage of population with at least 5th grade education in the United States with a correlation coefficient (R) of 0.258 and weighted average of 96.6%, a difference of 0.30%.
5th Grade Correlation Summary
| Measurement | Colombian | Immigrants from Trinidad and Tobago |
| Minimum | 91.8% | 91.4% |
| Maximum | 100.0% | 100.0% |
| Range | 8.2% | 8.6% |
| Mean | 97.1% | 97.1% |
| Median | 97.2% | 97.1% |
| Interquartile 25% (IQ1) | 96.3% | 96.5% |
| Interquartile 75% (IQ3) | 98.1% | 97.8% |
| Interquartile Range (IQR) | 1.8% | 1.3% |
| Standard Deviation (Sample) | 1.8% | 1.6% |
| Standard Deviation (Population) | 1.8% | 1.6% |
Similar Demographics by 5th Grade
Demographics Similar to Colombians by 5th Grade
In terms of 5th grade, the demographic groups most similar to Colombians are Ethiopian (96.9%, a difference of 0.010%), Immigrants from Asia (96.9%, a difference of 0.020%), Immigrants from Costa Rica (96.9%, a difference of 0.020%), Immigrants from Eastern Africa (96.9%, a difference of 0.020%), and Korean (96.9%, a difference of 0.020%).
| Demographics | Rating | Rank | 5th Grade |
| Asians | 2.0 /100 | #238 | Tragic 96.9% |
| Nigerians | 1.9 /100 | #239 | Tragic 96.9% |
| Indians (Asian) | 1.9 /100 | #240 | Tragic 96.9% |
| Immigrants | Asia | 1.7 /100 | #241 | Tragic 96.9% |
| Immigrants | Costa Rica | 1.6 /100 | #242 | Tragic 96.9% |
| Immigrants | Eastern Africa | 1.6 /100 | #243 | Tragic 96.9% |
| Koreans | 1.6 /100 | #244 | Tragic 96.9% |
| Colombians | 1.3 /100 | #245 | Tragic 96.9% |
| Ethiopians | 1.2 /100 | #246 | Tragic 96.9% |
| Immigrants | Africa | 1.1 /100 | #247 | Tragic 96.9% |
| U.S. Virgin Islanders | 1.1 /100 | #248 | Tragic 96.9% |
| Immigrants | Uruguay | 1.0 /100 | #249 | Tragic 96.9% |
| Immigrants | Liberia | 1.0 /100 | #250 | Tragic 96.9% |
| Bolivians | 0.9 /100 | #251 | Tragic 96.9% |
| Jamaicans | 0.9 /100 | #252 | Tragic 96.9% |
Demographics Similar to Immigrants from Trinidad and Tobago by 5th Grade
In terms of 5th grade, the demographic groups most similar to Immigrants from Trinidad and Tobago are Fijian (96.6%, a difference of 0.0%), Immigrants from Western Africa (96.6%, a difference of 0.010%), Houma (96.6%, a difference of 0.010%), Barbadian (96.6%, a difference of 0.010%), and Immigrants from St. Vincent and the Grenadines (96.6%, a difference of 0.010%).
| Demographics | Rating | Rank | 5th Grade |
| Immigrants | Bolivia | 0.1 /100 | #277 | Tragic 96.6% |
| Immigrants | Ghana | 0.1 /100 | #278 | Tragic 96.6% |
| Immigrants | Philippines | 0.1 /100 | #279 | Tragic 96.6% |
| Immigrants | Western Africa | 0.1 /100 | #280 | Tragic 96.6% |
| Houma | 0.1 /100 | #281 | Tragic 96.6% |
| Barbadians | 0.1 /100 | #282 | Tragic 96.6% |
| Fijians | 0.1 /100 | #283 | Tragic 96.6% |
| Immigrants | Trinidad and Tobago | 0.1 /100 | #284 | Tragic 96.6% |
| Immigrants | St. Vincent and the Grenadines | 0.1 /100 | #285 | Tragic 96.6% |
| Immigrants | Thailand | 0.1 /100 | #286 | Tragic 96.6% |
| Immigrants | Afghanistan | 0.1 /100 | #287 | Tragic 96.6% |
| Immigrants | Barbados | 0.0 /100 | #288 | Tragic 96.6% |
| Immigrants | West Indies | 0.0 /100 | #289 | Tragic 96.5% |
| British West Indians | 0.0 /100 | #290 | Tragic 96.5% |
| Malaysians | 0.0 /100 | #291 | Tragic 96.5% |