Blackfeet vs Immigrants from Trinidad and Tobago Ambulatory Disability
COMPARE
Blackfeet
Immigrants from Trinidad and Tobago
Ambulatory Disability
Ambulatory Disability Comparison
Blackfeet
Immigrants from Trinidad and Tobago
7.1%
AMBULATORY DISABILITY
0.0/ 100
METRIC RATING
314th/ 347
METRIC RANK
6.7%
AMBULATORY DISABILITY
0.1/ 100
METRIC RATING
271st/ 347
METRIC RANK
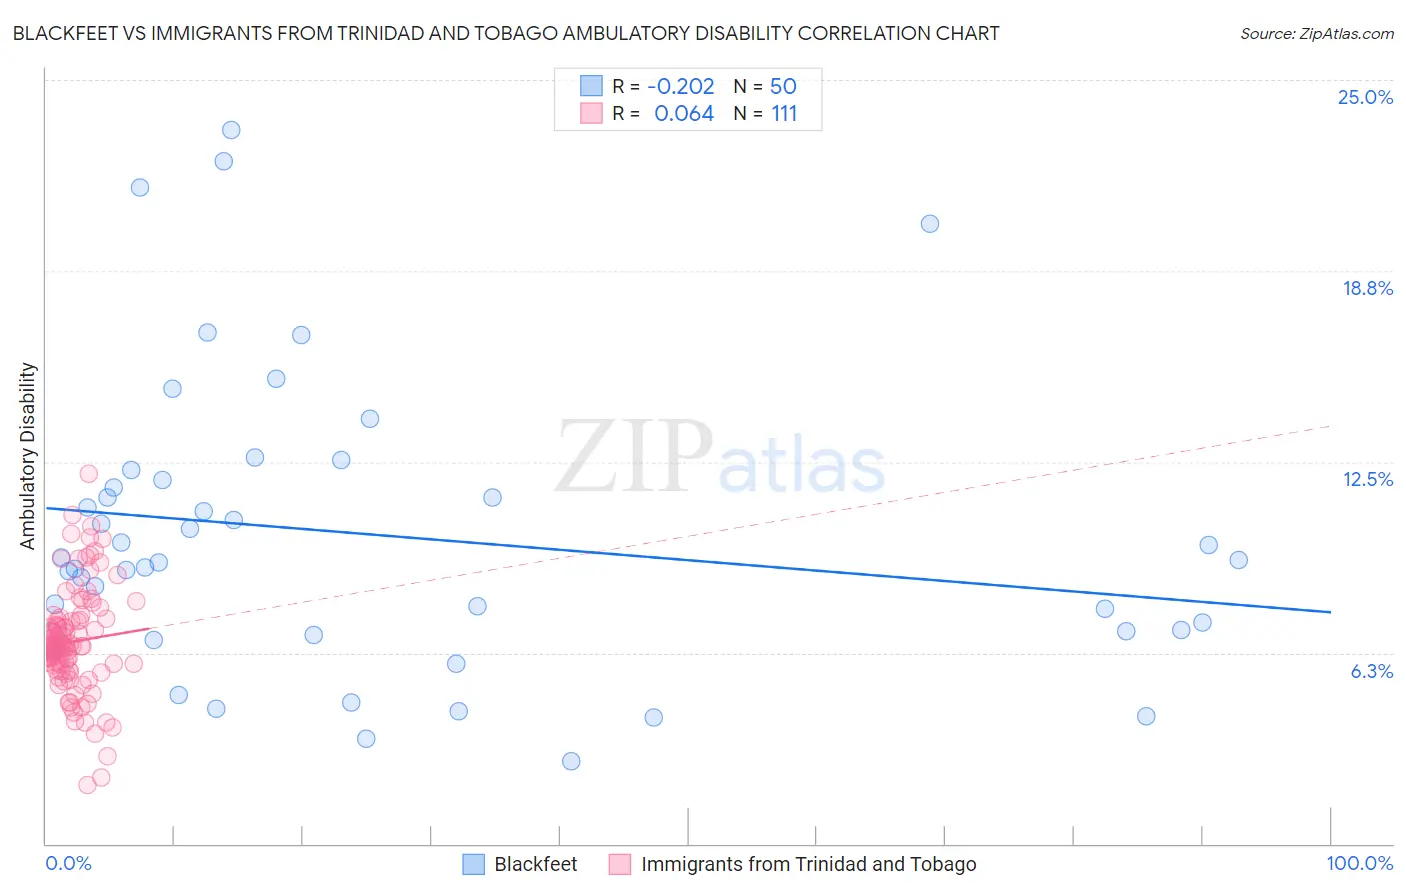
Blackfeet vs Immigrants from Trinidad and Tobago Ambulatory Disability Correlation Chart
The statistical analysis conducted on geographies consisting of 309,475,903 people shows a weak negative correlation between the proportion of Blackfeet and percentage of population with ambulatory disability in the United States with a correlation coefficient (R) of -0.202 and weighted average of 7.1%. Similarly, the statistical analysis conducted on geographies consisting of 223,483,943 people shows a slight positive correlation between the proportion of Immigrants from Trinidad and Tobago and percentage of population with ambulatory disability in the United States with a correlation coefficient (R) of 0.064 and weighted average of 6.7%, a difference of 7.0%.
Ambulatory Disability Correlation Summary
| Measurement | Blackfeet | Immigrants from Trinidad and Tobago |
| Minimum | 2.7% | 1.9% |
| Maximum | 23.4% | 12.1% |
| Range | 20.7% | 10.2% |
| Mean | 10.1% | 6.6% |
| Median | 9.2% | 6.5% |
| Interquartile 25% (IQ1) | 6.9% | 5.7% |
| Interquartile 75% (IQ3) | 11.9% | 7.3% |
| Interquartile Range (IQR) | 5.0% | 1.6% |
| Standard Deviation (Sample) | 4.8% | 1.7% |
| Standard Deviation (Population) | 4.8% | 1.7% |
Similar Demographics by Ambulatory Disability
Demographics Similar to Blackfeet by Ambulatory Disability
In terms of ambulatory disability, the demographic groups most similar to Blackfeet are Immigrants from Yemen (7.1%, a difference of 0.020%), Shoshone (7.1%, a difference of 0.020%), Delaware (7.1%, a difference of 0.15%), Immigrants from Dominican Republic (7.1%, a difference of 0.26%), and Central American Indian (7.2%, a difference of 0.34%).
| Demographics | Rating | Rank | Ambulatory Disability |
| Spanish Americans | 0.0 /100 | #307 | Tragic 7.1% |
| Chippewa | 0.0 /100 | #308 | Tragic 7.1% |
| Immigrants | Azores | 0.0 /100 | #309 | Tragic 7.1% |
| Arapaho | 0.0 /100 | #310 | Tragic 7.1% |
| Cree | 0.0 /100 | #311 | Tragic 7.1% |
| Delaware | 0.0 /100 | #312 | Tragic 7.1% |
| Immigrants | Yemen | 0.0 /100 | #313 | Tragic 7.1% |
| Blackfeet | 0.0 /100 | #314 | Tragic 7.1% |
| Shoshone | 0.0 /100 | #315 | Tragic 7.1% |
| Immigrants | Dominican Republic | 0.0 /100 | #316 | Tragic 7.1% |
| Central American Indians | 0.0 /100 | #317 | Tragic 7.2% |
| Ottawa | 0.0 /100 | #318 | Tragic 7.2% |
| Dominicans | 0.0 /100 | #319 | Tragic 7.2% |
| Potawatomi | 0.0 /100 | #320 | Tragic 7.3% |
| Apache | 0.0 /100 | #321 | Tragic 7.4% |
Demographics Similar to Immigrants from Trinidad and Tobago by Ambulatory Disability
In terms of ambulatory disability, the demographic groups most similar to Immigrants from Trinidad and Tobago are Slovak (6.7%, a difference of 0.10%), French (6.6%, a difference of 0.26%), French Canadian (6.7%, a difference of 0.36%), White/Caucasian (6.7%, a difference of 0.38%), and Spanish (6.6%, a difference of 0.56%).
| Demographics | Rating | Rank | Ambulatory Disability |
| Nepalese | 0.2 /100 | #264 | Tragic 6.6% |
| Bahamians | 0.2 /100 | #265 | Tragic 6.6% |
| Guyanese | 0.2 /100 | #266 | Tragic 6.6% |
| Trinidadians and Tobagonians | 0.2 /100 | #267 | Tragic 6.6% |
| Spanish | 0.2 /100 | #268 | Tragic 6.6% |
| French | 0.1 /100 | #269 | Tragic 6.6% |
| Slovaks | 0.1 /100 | #270 | Tragic 6.7% |
| Immigrants | Trinidad and Tobago | 0.1 /100 | #271 | Tragic 6.7% |
| French Canadians | 0.1 /100 | #272 | Tragic 6.7% |
| Whites/Caucasians | 0.1 /100 | #273 | Tragic 6.7% |
| Sioux | 0.1 /100 | #274 | Tragic 6.7% |
| Immigrants | Guyana | 0.1 /100 | #275 | Tragic 6.7% |
| Celtics | 0.1 /100 | #276 | Tragic 6.7% |
| Jamaicans | 0.1 /100 | #277 | Tragic 6.7% |
| Immigrants | West Indies | 0.1 /100 | #278 | Tragic 6.7% |